HA 市場バイアス
作者: リン・ハーンチャオチャン開催日:2022年5月9日 14:07:28タグ:エイマ
皆様,こんにちは.皆さんのお疲れさまでしたと思います.
この脚本をみんなと共有したいと思いました 役に立ちそうな人なら誰でも 市場状況を伝えるために使います
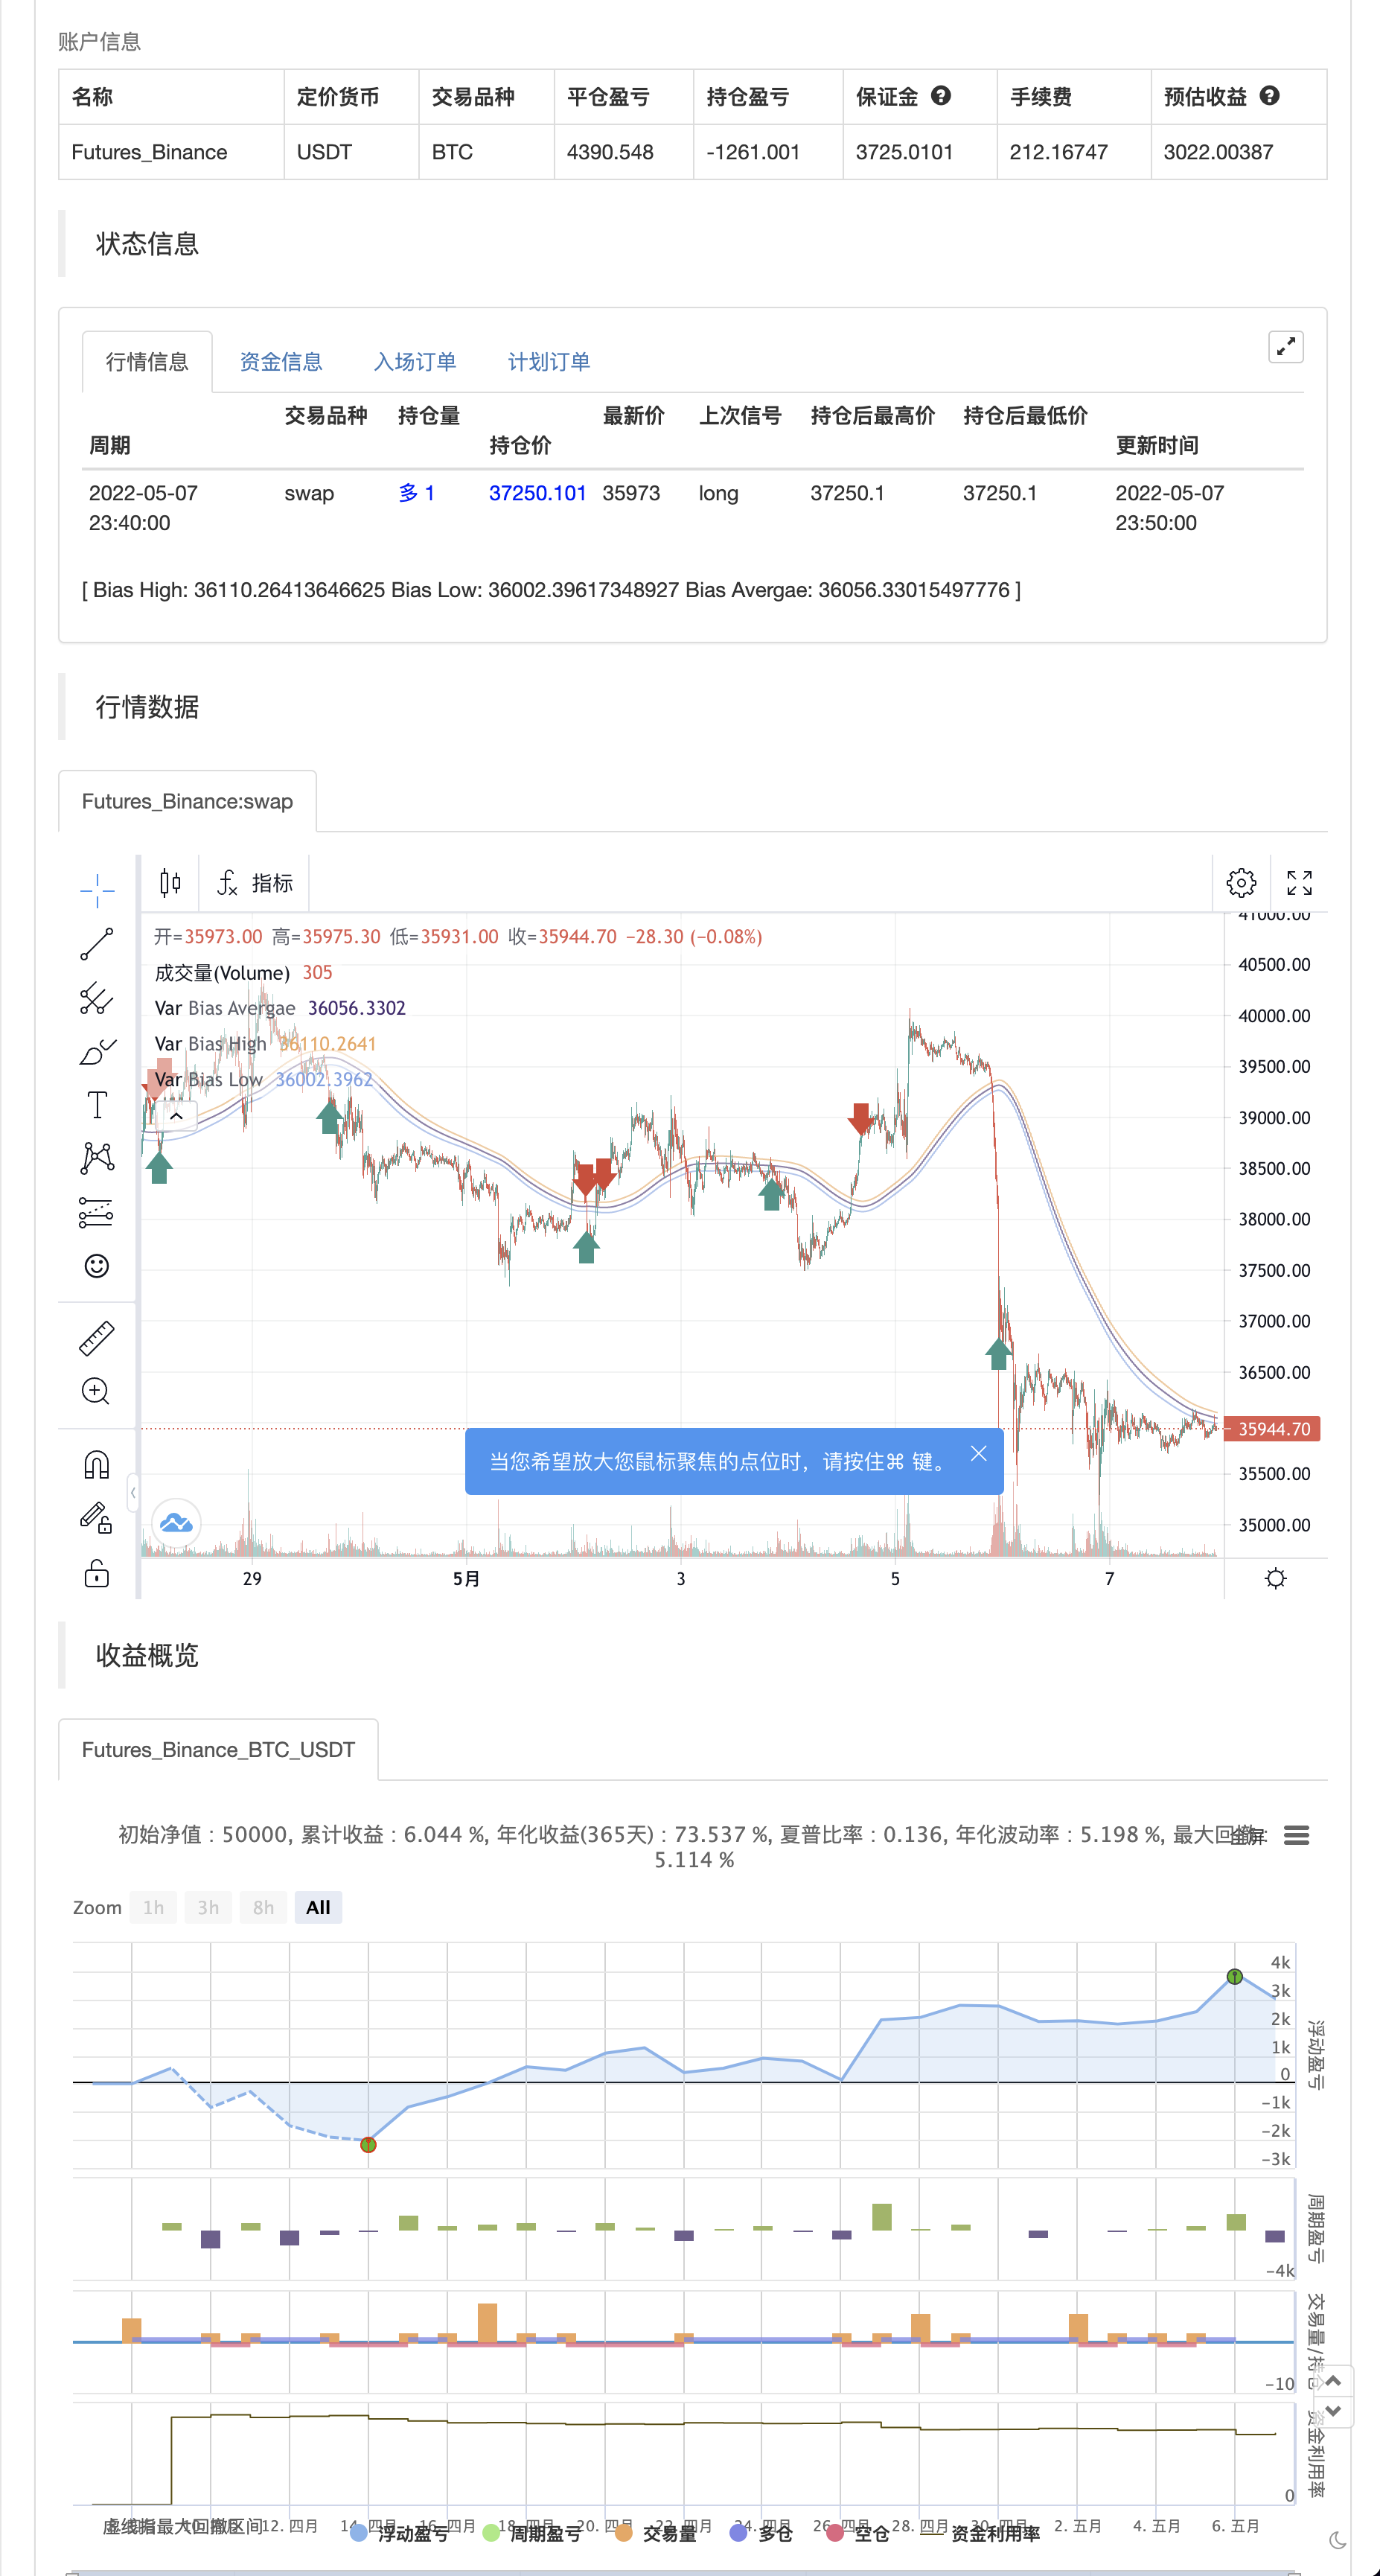
スクリプトは,スムーズなハイケン・アシのキャンドルを用いて市場の全体的な方向性を決定しようとします. カラーリングシステム (明るい色と暗い色を使用) は,強い市場と弱い市場状況を検出する試みです. スクリプトにはオシレーターもありますが,今はプロットされていません. @jackvmkへのクレジット,私はこの指標で彼のオープンスクリプトコードの一部を使用しました.
グラフの傾きを市場状況のフィルターとして利用することを検討しました. グラフは"フラット"市場では比較的平坦です. しかし,私はまだそれについて何もしていません. 別の時間かもしれません.
参考になれば,コメント欄でコミュニティと共有してください.
注: これは金融アドバイスではありません.あなたはあなたの研究を行い,あなたの取引スタイルと戦略にこの指標を適用する方法を見つけなければなりません.
これからの脚本には
バックテスト
/*backtest
start: 2022-04-08 00:00:00
end: 2022-05-07 23:59:00
period: 10m
basePeriod: 1m
exchanges: [{"eid":"Futures_Binance","currency":"BTC_USDT"}]
*/

// This source code is subject to the terms of the Mozilla Public License 2.0 at https://mozilla.org/MPL/2.0/
// © Professeur_X

//@version=5

indicator(title='HA Market Bias', shorttitle='HA Market Bias', overlay=true)

tf(_res, _exp, gaps_on) =>
    gaps_on == 0 ? request.security(syminfo.tickerid, _res, _exp) : gaps_on == true ? request.security(syminfo.tickerid, _res, _exp, barmerge.gaps_on, barmerge.lookahead_off) : request.security(syminfo.tickerid, _res, _exp, barmerge.gaps_off, barmerge.lookahead_off)

ha_htf = ''
show_ha = input.bool(true, "Show HA Plot/ Market Bias", group="HA Market Bias")
ha_len = input(100, 'Period', group="HA Market Bias")
ha_len2 = input(100, 'Smoothing', group="HA Market Bias")

// Calculations {
o = ta.ema(open, ha_len)
c = ta.ema(close, ha_len)
h = ta.ema(high, ha_len)
l = ta.ema(low, ha_len)

haclose = tf(ha_htf, (o + h + l + c) / 4, 0)
xhaopen = tf(ha_htf, (o + c) / 2, 0)
haopen = na(xhaopen[1]) ? (o + c) / 2 : (xhaopen[1] + haclose[1]) / 2
hahigh = math.max(h, math.max(haopen, haclose))
halow = math.min(l, math.min(haopen, haclose))


o2 = tf(ha_htf, ta.ema(haopen, ha_len2), 0)
c2 = tf(ha_htf, ta.ema(haclose, ha_len2), 0)
h2 = tf(ha_htf, ta.ema(hahigh, ha_len2), 0)
l2 = tf(ha_htf, ta.ema(halow, ha_len2), 0)

ha_avg = (h2 + l2) / 2
// }

// Oscillator {
osc_len = input.int(7, "Oscillator Period", group="HA Market Bias")

osc_bias = 100 *(c2 - o2)
osc_smooth = ta.ema(osc_bias, osc_len)

sigcolor =
  (osc_bias > 0) and (osc_bias >= osc_smooth) ? color.new(color.lime, 35) :
  (osc_bias > 0) and (osc_bias < osc_smooth) ? color.new(color.lime, 75) :
  (osc_bias < 0) and (osc_bias <= osc_smooth) ? color.new(color.red, 35) :
  (osc_bias < 0) and (osc_bias > osc_smooth) ? color.new(color.red, 75) :
  na
// }

// Plots {
p_h = plot(h2, "Bias High", display=display.none, editable=false)
p_l = plot(l2, "Bias Low", display=display.none, editable=false)
p_avg = plot(ha_avg, "Bias Avergae", display=display.none, editable=false)


col = o2 > c2 ? color.red : color.lime

if o2 > c2
    strategy.entry("Enter Long", strategy.long)
else if o2 < c2
    strategy.entry("Enter Short", strategy.short)
関連性
- RSI/MACD/ATRとの強化されたEMAクロスオーバー戦略
- Zスコア 戦略をフォローする傾向
- 長期入札は,EMAのリスク管理戦略と交差する
- VWAPの取引戦略
- WaveTrend クロス LazyBear 戦略
- AlphaTradingBotの取引戦略
- RSIと二重EMAのクロスオーバー・シグナル量的な戦略
- エリオット波理論 4-9 インパルス波自動検出 取引戦略
- KRK aDa ストーカスティック AI 強化の遅い平均逆転戦略
- EMA23/EMA50 ダブル移動平均のクロスオーバー量的な取引戦略
- MACD ゴールデンクロスとデスクロス戦略
もっと
- TVの高低戦略
- 最良のトレードビュー戦略
- 大型スナッパーの警告 R3.0 + 変動状態の上昇 + TP RSI
- チャンデ・クロル ストップ
- CCI + EMAとRSIクロス戦略
- EMA バンド + leledc + ボリンガー バンド トレンドキャッチ戦略
- RSI MTF Ob+Os
- MACD ウィリー戦略
- RSI - 買って売るシグナル
- ハイキン・アシ 傾向
- イチモク雲スムーズオシレーター
- ウィリアムズ %R - 滑らか
- QQEMOD + SSLハイブリッド + ワダアター爆発
- ストラットを購入/売却
- トリプルスーパートレンドとEMAとADX
- トム・デマルク 連続熱地図
- jma + dwma 多穀物による
- マジックMACD
- 信号によるZスコア
神 易波動率戦略 パイン語版