TMA-レガシー
作者: リン・ハーンチャオチャン, 日時: 2022-05-09 22:38:11タグ:RSI
これは PhoenixBinary のオリジナルの TMA-RSI ダイバージェンス指標に基づいたスクリプトです
Phoenix BinaryのコミュニティとTMAコミュニティは,このバージョンをコミュニティの公開コードとして作成し,Fenix Binaryの報告された死後,コミュニティのさらなる使用と修正のために作成しました. (コミュニティは,Phoenix
意図された用途は元のものと同じですが,いくつかの計算は異なるため,元の動作や信号とは異なる可能性があります.
初期からの指標の説明 この指標はアーティとクリスティにインスピレーションを受けた
█ コンポーネント
以下は,最初の投稿からの指標の概要です.
1
2 調整されたRSI差異 スムーズなRSIディバージェンスは,RSI線をスムーズにするための異なる計算によるより遅いRSIです.これは価格アクションの異なる視点とトレンドの長期的視点を提供します.浮動50のクロスが伝統的なRSIを浮動50と並べると,RSIは浮動50を横断します.
3 動力差 これには少し時間がかかるが これと他の2つを組み合わせると
バックテスト
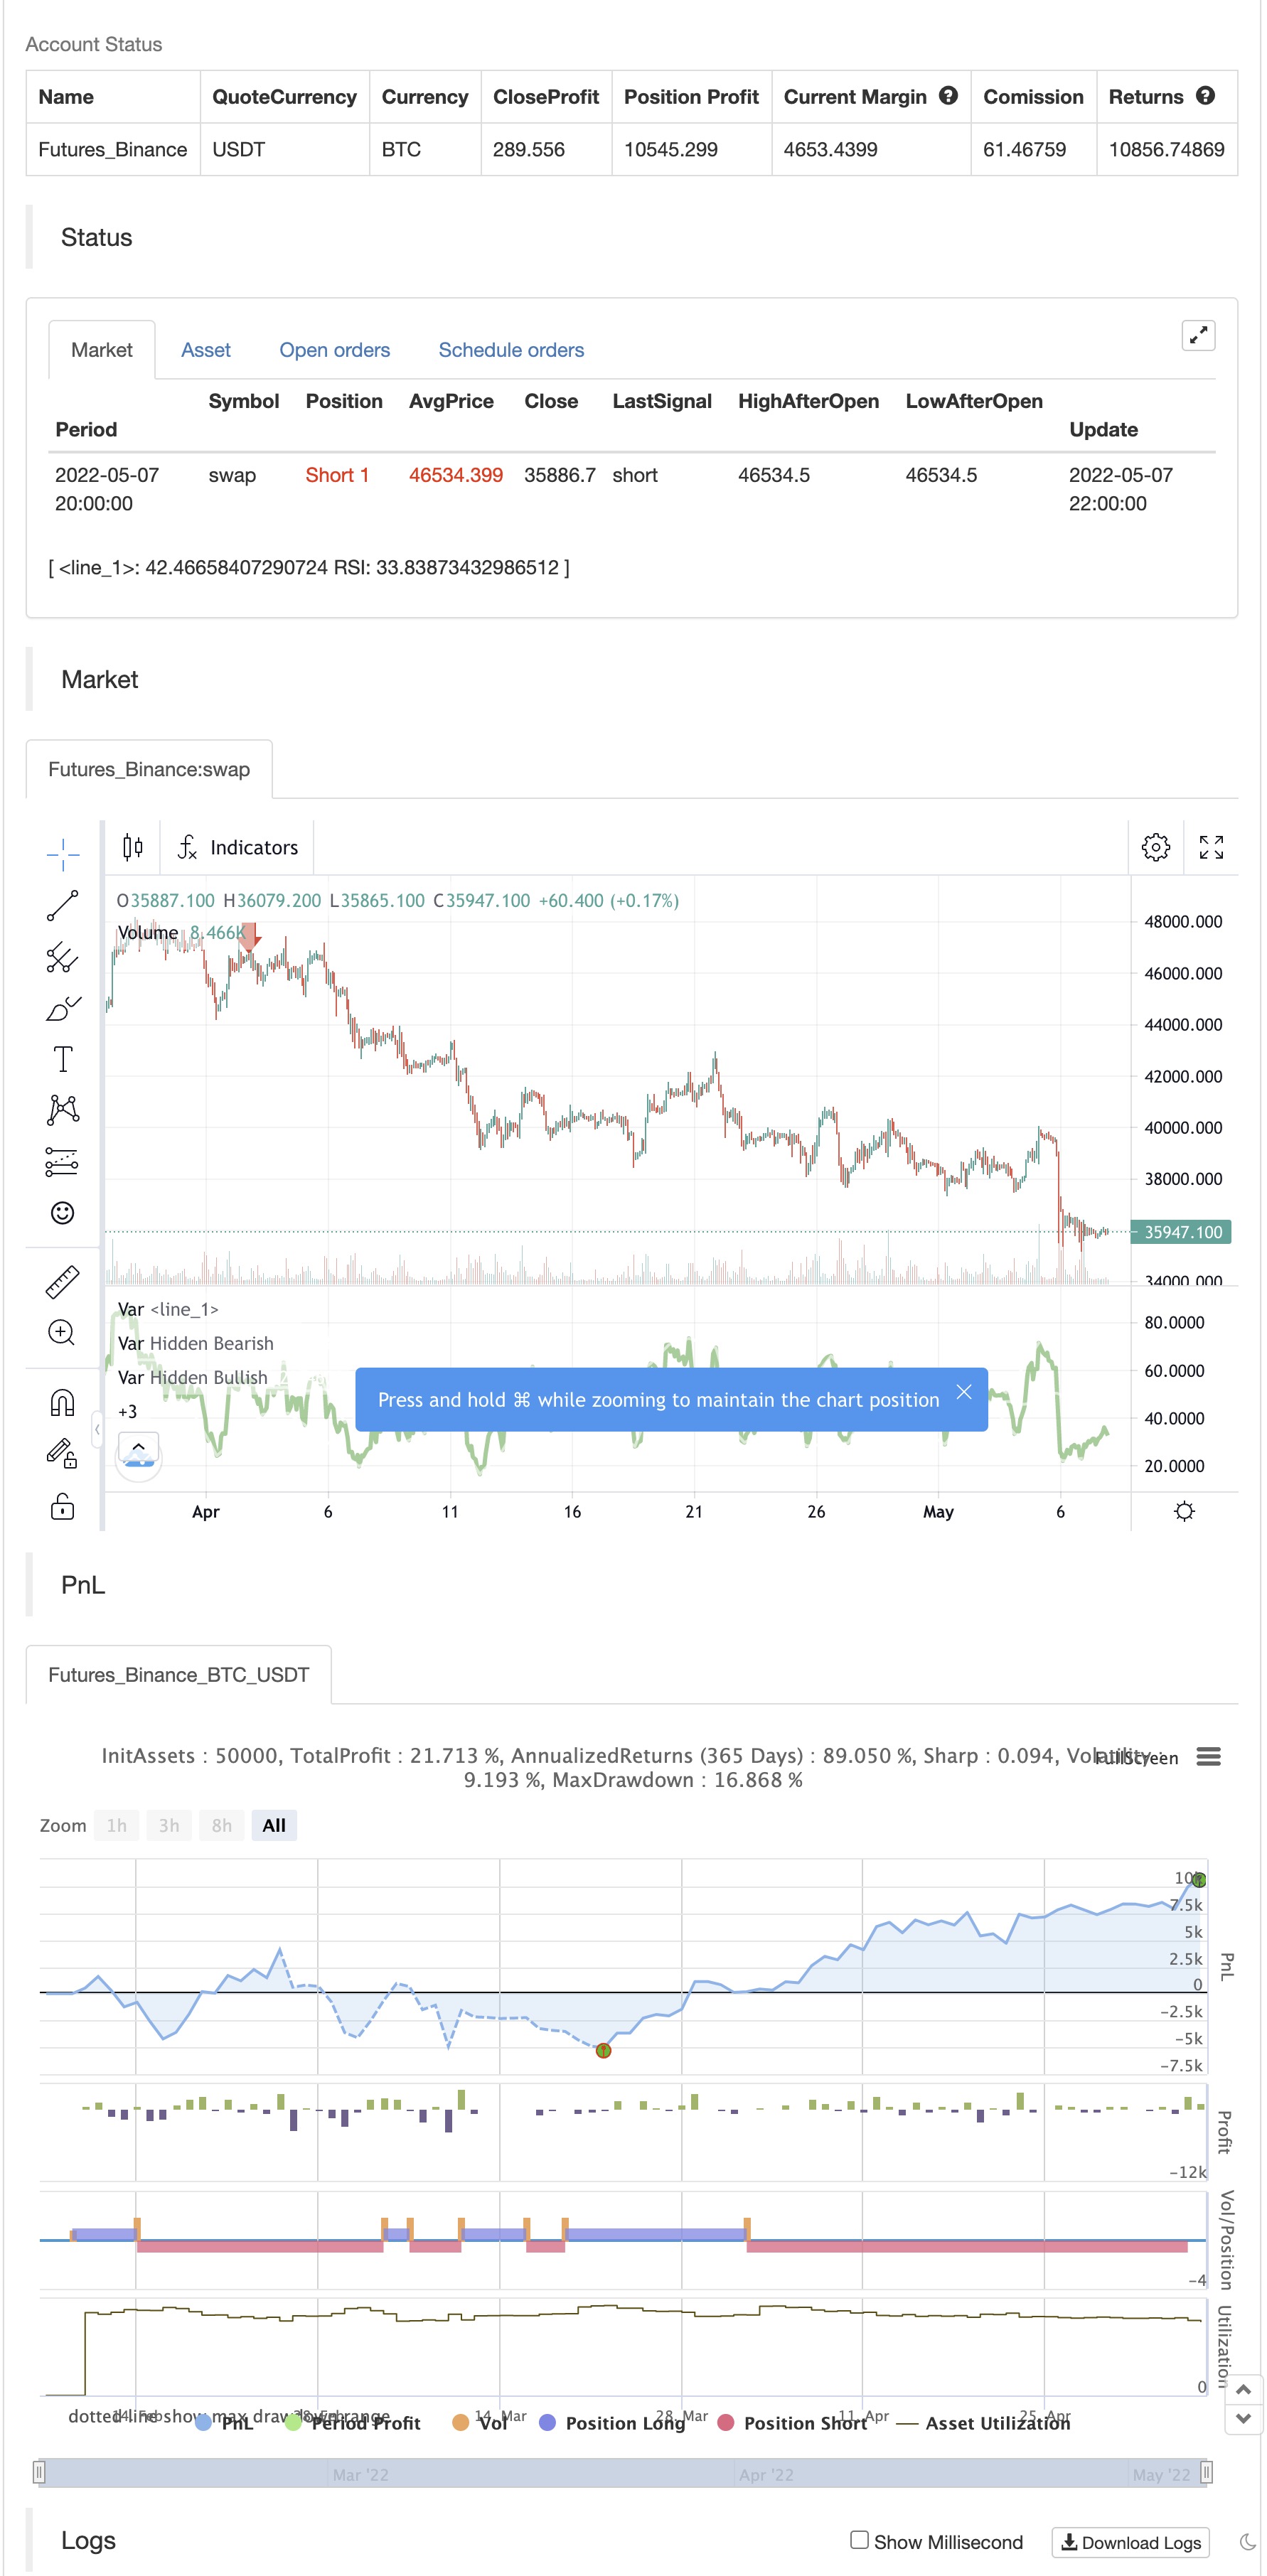
/*backtest
start: 2022-02-08 00:00:00
end: 2022-05-08 00:00:00
period: 2h
basePeriod: 15m
exchanges: [{"eid":"Futures_Binance","currency":"BTC_USDT"}]
*/

//// This source code is subject to the terms of the Mozilla Public License 2.0 at https://mozilla.org/MPL/2.0/
// ©Hotchachachaa, Rest in Peace Pheonix Algo(aka Doug) your community misses you and we extend our deepest sympathies to your family.
//@version=5
//
//This indicator is based on the TMA-Divergence indicator created by PhoenixBinary for the TMA discord Community. Since Phoenix is no longer part of the community
//we did our best to recreate the indicator for the community's continued use updates and revisions.
indicator("TMA-Legacy", overlay=false)

////////////////////////////////////inputs////////////////////////////////////////////////

displayRSI = input.string(title="RSI Type", defval="RSI Divergence", options=["RSI Divergence","RSI Smoothed","RSI Momentum"],group="Main Settings")
lenrsinordiv = input.int(title="RSI Normal Length", defval=14,minval=1, group= "RSI Normal")
lenrsismodiv = input.int(title="RSI Smoothed Length", defval=40, minval=1,group = "RSI Smoothed" )
lenrsissmoma = input.int(title="RSI Smoothed MA", defval=40,minval=1, group = "RSI Smoothed" )
lenrsimomdiv = input.int(title="RSI Normal Length", defval=5 ,minval=1, group = "RSI Momentum")
rsimommalen = input.int(34, minval=1, title="Smooth RSI MA Length",group="RSI Momentum")
srcrsidiv = input(title="RSI Source", defval=close, group="Main Settings")
lbR = input.int(title="Pivot Lookback Right", defval=5,minval=1,group="Divergence Spotter")
lbL = input.int(title="Pivot Lookback Left", defval=5,minval=1,group="Divergence Spotter")
rangeUpper = input.int(title="Max of Lookback Range", defval=60,minval=1,group="Divergence Spotter")
rangeLower = input.int(title="Min of Lookback Range", defval=5,minval=1,group="Divergence Spotter")
plotBull = input.bool(title="Plot Bullish", defval=true,group="Divergence Spotter")
plotHiddenBull = input.bool(title="Plot Hidden Bullish", defval=true,group="Divergence Spotter")
plotBear = input.bool(title="Plot Bearish", defval=true,group="Divergence Spotter")
plotHiddenBear = input.bool(title="Plot Hidden Bearish", defval=true,group="Divergence Spotter")
bearColorrsidiv = color.red
bullColorrsidiv = color.green
hiddenBullColor = color.new(color.green, 80)
hiddenBearColor = color.new(color.red, 80)
textColor = color.white
noneColor = color.new(color.white, 100)
lenDisplay= displayRSI == "RSI Divergence" ? lenrsinordiv: displayRSI == "RSI Smoothed" ? lenrsismodiv: na
rsiValue1 = ta.rsi(srcrsidiv, lenrsinordiv)

// ### Smoothed MA

averageSource = rsiValue1
typeofMA1 = "SMMA"
length_ma1 = 50
f_smma(averageSource, averageLength) =>
    smma = 0.0
    smma := na(smma[1]) ? ta.sma(averageSource, averageLength) : (smma[1] * (averageLength - 1) + averageSource) / averageLength
    smma

f_smwma(averageSource, averageLength) =>
    smwma = 0.0
    smwma := na(smwma[1]) ? ta.wma(averageSource, averageLength) : (smwma[1] * (averageLength - 1) + averageSource) / averageLength
    smwma

f_tma(averageSource, averageLength) =>
    ta.sma(ta.sma(averageSource, averageLength), averageLength)

f_dema(averageSource, averageLength) =>
    emaValue = ta.ema(averageSource, averageLength)
    2 * emaValue - ta.ema(emaValue, averageLength)

f_tema(averageSource, averageLength) =>
    ema1 = ta.ema(averageSource, averageLength)
    ema2 = ta.ema(ema1, averageLength)
    ema3 = ta.ema(ema2, averageLength)
    (3 * ema1) - (3 * ema2) + ema3

f_ma(smoothing, averageSource, averageLength) =>
	switch str.upper(smoothing)
        "SMA"  => ta.sma(averageSource, averageLength)
        "EMA"  => ta.ema(averageSource, averageLength)
        "WMA"  => ta.wma(averageSource, averageLength)
        "HMA"  => ta.hma(averageSource, averageLength)
        "RMA"  => ta.rma(averageSource, averageLength)
        "SWMA" => ta.swma(averageSource)
        "ALMA" => ta.alma(averageSource, averageLength, 0.85, 6)
        "VWMA" => ta.vwma(averageSource, averageLength)
        "VWAP" => ta.vwap(averageSource)
        "SMMA" =>  f_smma(averageSource, averageLength)
        "SMWMA" =>  f_smwma(averageSource, averageLength)
        "DEMA" => f_dema(averageSource, averageLength)
        "TEMA"=>  f_tema(averageSource, averageLength)
        => runtime.error("Moving average type '" + smoothing +
             "' not found!"), na


MA1 = f_ma(typeofMA1, averageSource, length_ma1)
showNormal=displayRSI=="RSI Divergence"
showSmoothed=displayRSI=="RSI Smoothed"
showMomentum = displayRSI =="RSI Momentum"
showAll= displayRSI=="All Three"
///////OB/OS lines

hline(showNormal or showSmoothed ? 80 :na, title="OverBought", linestyle=hline.style_dotted, linewidth=2)
hline(showNormal or showSmoothed ? 20 :na, title="OverSold", linestyle=hline.style_dotted, linewidth=2)
////////////////show normal

plot(showNormal? MA1 : na , linewidth=2, color=color.white)

var int colortoken=1

color1= color.green
color2 = color.yellow
color3 = color.orange
color4 = color.red

if rsiValue1>rsiValue1[1] and colortoken!=1
    colortoken:= colortoken[1] - 1

if rsiValue1<rsiValue1[1] and colortoken!=4
    colortoken:= colortoken[1] + 1

lineColor= colortoken == 1 ? color1: colortoken ==2 ? color2 : colortoken == 3 ? color3 : colortoken == 4 ? color4 :na

plot(showNormal? rsiValue1 : na, title="RSI", linewidth=3, color=lineColor)


////////////show smoothed
lensig = input.int(14, title="ADX Smoothing", minval=1, maxval=50)
len = input.int(14, minval=1, title="DI Length")
up = ta.change(high)
down = -ta.change(low)
plusDM = na(up) ? na : (up > down and up > 0 ? up : 0)
minusDM = na(down) ? na : (down > up and down > 0 ? down : 0)
trur = ta.rma(ta.tr, len)
plus = fixnan(100 * ta.rma(plusDM, len) / trur)
minus = fixnan(100 * ta.rma(minusDM, len) / trur)
sum = plus + minus
adx = 100 * ta.rma(math.abs(plus - minus) / (sum == 0 ? 1 : sum), lensig)
rsisrc = ta.rsi(close,lenrsismodiv)
adxthreshold=input.int(title="adx",defval=15)
smoothColor= adx>adxthreshold and plus>minus? color.green:adx>adxthreshold and plus<minus?color.red : adx<adxthreshold?color.gray:na

rsismma = 0.0
rsismma := na(rsismma[1]) ? ta.sma(rsisrc, lenrsissmoma) : (rsismma[1] * (lenrsissmoma - 1) + rsisrc) / lenrsissmoma
rsiwsmma= ta.wma(rsismma,lenrsissmoma)
plot(showSmoothed ? rsisrc:na, linewidth=2, color=smoothColor)
plot(showSmoothed ? rsiwsmma:na, linewidth=2, color=color.white)


////////////////RSI momentum
///////////////////// normal RSI
rsiValue2 = ta.rsi(ohlc4,lenrsimomdiv)
rsiema = ta.wma(rsiValue2,rsimommalen)
normalizedRSI= (rsiValue2-50)/100

/////////////////// Normal Momentum
lenmom = input.int(5, minval=1, title=" MOM Length",group= "RSI Momentum")
srcmom = ohlc4
mom = srcmom - srcmom[lenmom]

//////////stochRSI K line
smoothK = input.int(5, "K", minval=1)
lengthRSI = input.int(5, "RSI Length", minval=1, group="RSI Momentum")
lengthStoch = input.int(34, "Stochastic Length", minval=1,group= "RSI Momentum")
src = input(ohlc4, title="RSI Source",group= "RSI Momentum")
rsi1 = ta.rsi(src, lengthRSI)
k = ((ta.sma(ta.stoch(rsi1, rsi1, rsi1, lengthStoch), smoothK))-50)/100

WTF=math.avg(mom,normalizedRSI,k)
smmaLen = input.int(25, minval=1, title="SMMA Length", group = "RSI Momentum")
smmaLen1= 2
smmaSrc = WTF
WTFsmma = 0.0
WTFsmma := na(WTFsmma[1]) ? ta.sma(smmaSrc, smmaLen1) : (WTFsmma[1] * (smmaLen1 - 1) + smmaSrc) / smmaLen1
smma = 0.0
smma := na(smma[1]) ? ta.sma(smmaSrc, smmaLen) : (smma[1] * (smmaLen - 1) + smmaSrc) / smmaLen


color1a= #0E3F01
color2a = #31FA2A
color3a = #FA6B6B
color4a = #971643

momentumColor= WTF>WTF[1] and WTF>smma ? color1a : WTF<WTF[1] and WTF>smma ? color2a : WTF>WTF[1] and WTF<smma ? color3a : WTF<WTF[1] and WTF<smma ? color4a : na


plot(showMomentum ? WTF:na, color=momentumColor, linewidth=3)
plot(showMomentum ? smma:na , linewidth=2, color=color.white)


osc= displayRSI =="RSI Divergence" ? rsiValue1 : displayRSI =="RSI Smoothed" ? rsisrc:na

///////////divergence
plFound = na(ta.pivotlow(osc, lbL, lbR)) ? false : true
phFound = na(ta.pivothigh(osc, lbL, lbR)) ? false : true
_inRange(cond) =>
	bars = ta.barssince(cond == true)
	rangeLower <= bars and bars <= rangeUpper

//------------------------------------------------------------------------------
// Regular Bullish
// Osc: Higher Low

oscHL = osc[lbR] > ta.valuewhen(plFound, osc[lbR], 1) and _inRange(plFound[1])

// Price: Lower Low

priceLL = low[lbR] < ta.valuewhen(plFound, low[lbR], 1)
bullCond = plotBull and priceLL and oscHL and plFound

plot(
     displayRSI !="RSI Momentum"and plFound ? osc[lbR] : na,
     offset=-lbR,
     title="Regular Bullish",
     linewidth=2,
     color=(bullCond ? bullColorrsidiv : noneColor)

     )


//------------------------------------------------------------------------------
// Hidden Bullish
// Osc: Lower Low

oscLL = osc[lbR] < ta.valuewhen(plFound, osc[lbR], 1) and _inRange(plFound[1])

// Price: Higher Low

priceHL = low[lbR] > ta.valuewhen(plFound, low[lbR], 1)
hiddenBullCond = plotHiddenBull and priceHL and oscLL and plFound

plot(
	 displayRSI !="RSI Momentum" and plFound ? osc[lbR] : na,
	 offset=-lbR,
	 title="Hidden Bullish",
	 linewidth=2,
	 color=(hiddenBullCond ? hiddenBullColor : noneColor)

	 )


//------------------------------------------------------------------------------
// Regular Bearish
// Osc: Lower High

oscLH = osc[lbR] < ta.valuewhen(phFound, osc[lbR], 1) and _inRange(phFound[1])

// Price: Higher High

priceHH = high[lbR] > ta.valuewhen(phFound, high[lbR], 1)

bearCond = plotBear and priceHH and oscLH and phFound

plot(
	 displayRSI !="RSI Momentum" and phFound ? osc[lbR] : na,
	 offset=-lbR,
	 title="Regular Bearish",
	 linewidth=2,
	 color=(bearCond ? bearColorrsidiv : noneColor)

	 )


//------------------------------------------------------------------------------
// Hidden Bearish
// Osc: Higher High

oscHH = osc[lbR] > ta.valuewhen(phFound, osc[lbR], 1) and _inRange(phFound[1])

// Price: Lower High

priceLH = high[lbR] < ta.valuewhen(phFound, high[lbR], 1)

hiddenBearCond = plotHiddenBear and priceLH and oscHH and phFound

plot(
	 displayRSI !="RSI Momentum" and phFound ? osc[lbR] : na,
	 offset=-lbR,
	 title="Hidden Bearish",
	 linewidth=2,
	 color=(hiddenBearCond ? hiddenBearColor : noneColor)

	 )


// ### Alerts


if bearCond
    alert("Bearish Divergence")
else if hiddenBearCond
    alert("Hidden Bearish Divergence")
else if bullCond
    alert("Bullish Divergence")
else if hiddenBullCond
    alert("Hidden Bullish Divergence")

if hiddenBullCond
    strategy.entry("Enter Long", strategy.long)
else if hiddenBearCond
    strategy.entry("Enter Short", strategy.short)


// END ###
関連性
- MACD RSI イチモク・モメンタム・トレンド 長期戦略に続く
- RSIの方向転換戦略
- 強化されたボリンガー帯のRSI取引戦略
- ピボットとモメンタム戦略
- 移動平均値とRSIの包括的な取引戦略
- ターンオーバー火曜日の戦略 (週末フィルター)
- RSI/MACD/ATRとの強化されたEMAクロスオーバー戦略
- MACD と RSI の組み合わせた長期取引戦略
- RSI2 ストラテジー 日中の逆転 勝利率 バックテスト
- 戦略をフォローする多指標の傾向
- AlphaTradingBotの取引戦略
もっと
- MA ハイブリッド BY RAJ
- ダイヤモンド の 傾向
- ニク・ストック
- ストックスーパーTRD ATR 200MA
- MTF RSI & STOCH戦略
- EMA + AROON + ASH
- モメント 2.0
- EHMAの範囲戦略
- 移動平均 買出 売出
- ミダス Mk.II - 究極の暗号スイング
- TVの高低戦略
- 最良のトレードビュー戦略
- 大型スナッパーの警告 R3.0 + 変動状態の上昇 + TP RSI
- チャンデ・クロル ストップ
- CCI + EMAとRSIクロス戦略
- EMA バンド + leledc + ボリンガー バンド トレンドキャッチ戦略
- RSI MTF Ob+Os
- MACD ウィリー戦略
- RSI - 買って売るシグナル
- ハイキン・アシ 傾向