トレーリングブレイクアウト戦略

概要
この戦略は,主に<unk>唐<unk>通道<unk>指標を使用して,追跡型の突破取引戦略を実現する.この戦略は,傾向と突破の2つの取引考え方とを組み合わせ,長線トレンドの判断に基づいて,より短い周期の突破点を探して,トレンドの状況で順調な取引を実現する.さらに,この戦略は,各取引のリスクと利益の比率を制御するために,止損と停止のレベルを設定する.全体的に,この戦略は,トレンドを追跡する利点があり,順調に,長線トレンドの機会をつかむことができる.
戦略原則
-
<unk>東<unk>通道<unk>指数のパラメータを設定し,デフォルト周期は20;
-
EMA平滑移動均線を設定し,デフォルト周期は200;
-
リスク・リターン比率を設定します.
-
突破回転のパラメータを,多頭と空頭に設定する.
-
破綻が高点か低点かを記録する
-
マルチヘッドシグナル: 前回のブレイクが低点であり,価格が唐津上線より高く,EMA平均線より高く,マルチヘッドシグナルを生成する.
-
空頭シグナル:上回のブレイクが高点であり,価格が唐津下位軌道より低く,EMA平均線より低い場合,空頭シグナルを生成する.
-
多頭ポジションに入ると,ストップロスは唐<unk>下線で5ポイント引き下げ,ストップはリスク/利益比でストップ距離を掛けます.
-
空頭ポジションに入ると,ストップロッドをドンチアン上線で5点引き戻し,ストップはリスク/利益の比率でストップロッドの距離を掛けます.
このようにして,戦略は,トレンド判断と突破操作を組み合わせて,順番に,長線トレンドの中でより短い周期の機会を捕捉することができます.同時に,ストップ・ストップの設定は,単一の取引のリスク・リターンを制御することができます.
優位分析
-
長期トレンドを追跡し,順位を把握し,逆行を避ける.
-
唐<unk>通路は,長線指標として,EMA均線フィルターと組み合わせて,トレンド方向をよく判断することができる.
-
損失防止器具は,個々のリスクを制御し,潜在的な損失を制限します.
-
リスクと利益の比率を最適化することで,利益と損失の比率を大きくし,利益の余剰を追求することができる.
-
回測パラメータの設定は柔軟で,異なる市場に対して最適なパラメータの組み合わせを調整できます.
リスク分析
-
唐<unk>通路とEMA均線はフィルタリング指標として,誤信号を発する可能性がある.
-
突破する取引は簡単に騙されやすいので,トレンドの背景を明確に識別する必要があります.
-
ストップダストストップの距離は固定であり,市場の変動に合わせて調整することはできません.
-
パラメータの最適化スペースは限られており,リッドディスクの効果は保証できません.
-
取引システムにはランダムな事件が多すぎると判断されず,ブラック・スウィーン事件は大きな損失を招く可能性があります.
最適化の方向
-
シグナル品質を向上させるため,振動指数など,より多くの指標をフィルタリングすることを考えることができます.
-
スマートストップを設定し,市場の変動度とATR指標の動向に応じて損益位置を調整します.
-
マシン・ラーニングなどの手法でパラメータをテストし,最適化することで,現実市場に近いものになります.
-
入場論理を最適化して,VOLUMEまたは波動率指標を補助条件として設定し,トラップを回避できます.
-
トレンド追跡戦略や機械学習と組み合わせて,混合戦略を形成し,安定性を向上させることも考えられます.
要約する
この戦略は,追跡型突破戦略として,核心構想は,長線トレンドを前提として,突破を信号として順調に操作し,単一取引のリスクを制御するストップ・ストップを設定することです.この戦略には一定の利点がありますが,いくつかの最適化可能なスペースもあります.全体的に,パラメータ設定,入場タイミングの選択などの問題をうまく処理でき,他の技術で補強されれば,この戦略は実用的なトレンド追跡戦略になることができます.しかし,投資家は,いかなる取引システムも市場リスクを完全に回避することはできませんが,リスク管理をよくする必要があります.
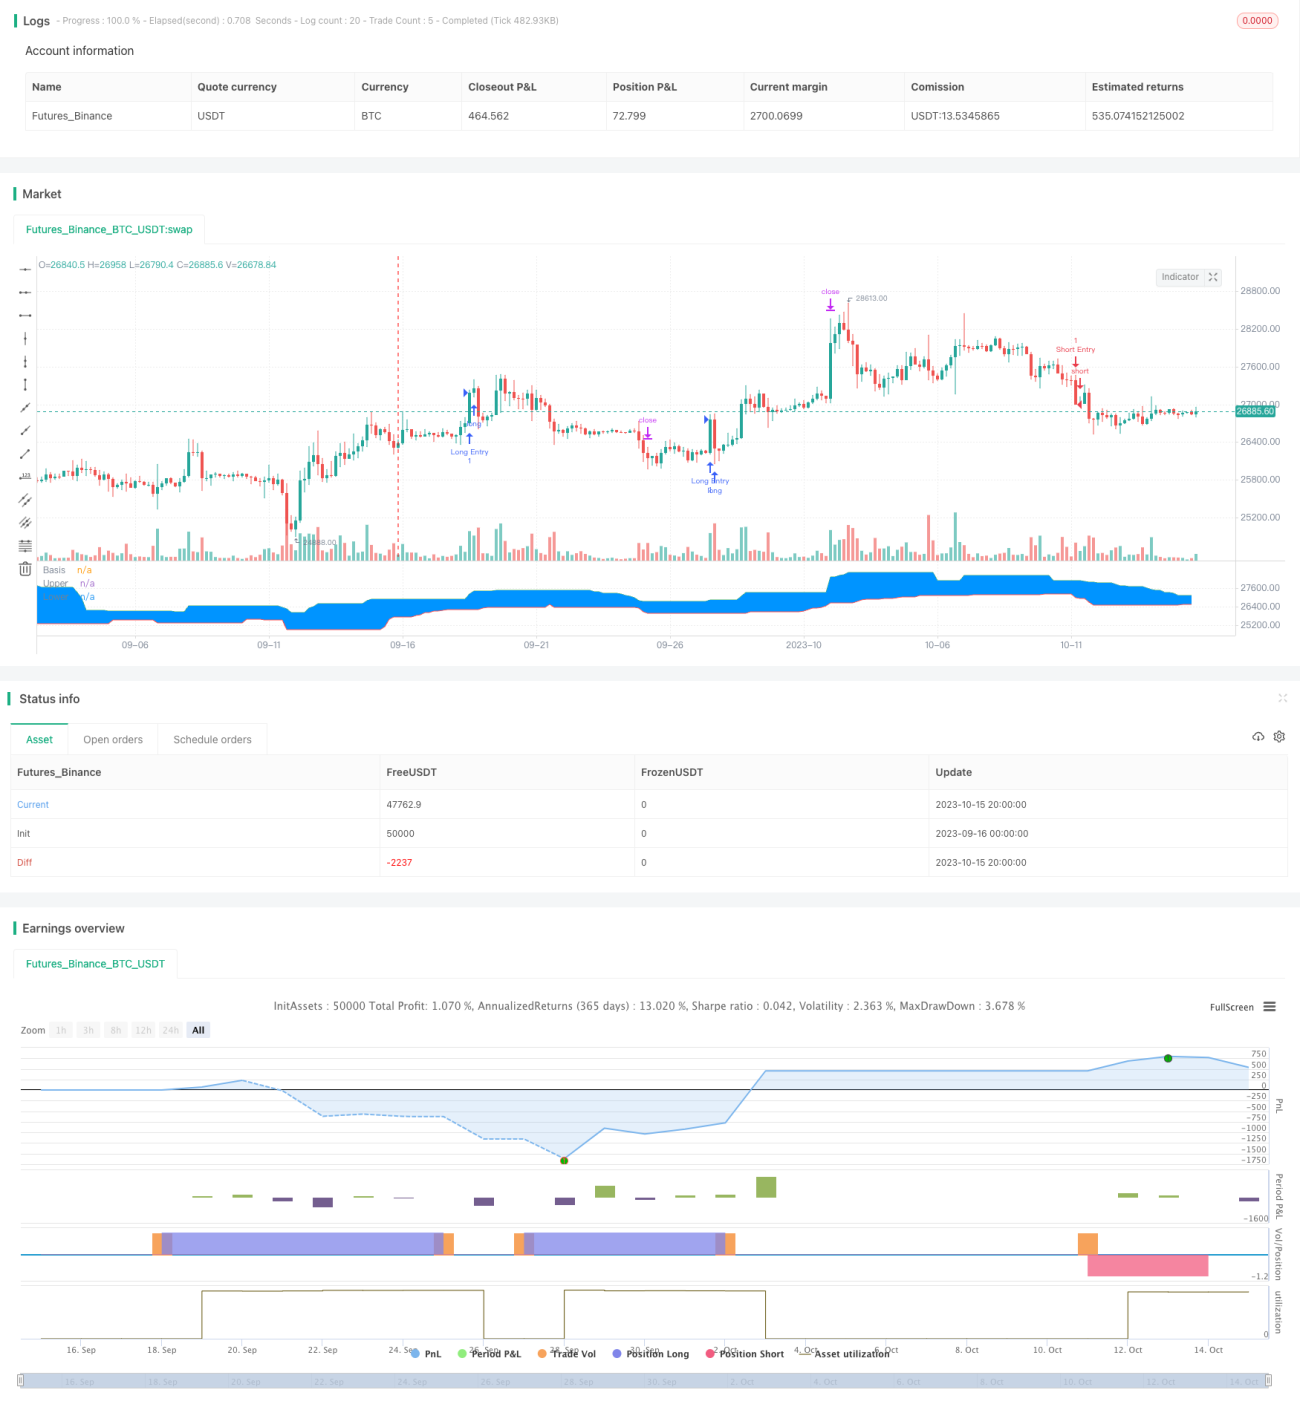
/*backtest
start: 2023-09-16 00:00:00
end: 2023-10-16 00:00:00
period: 4h
basePeriod: 15m
exchanges: [{"eid":"Futures_Binance","currency":"BTC_USDT"}]
*/

//@version=4
// Welcome to my second script on Tradingview with Pinescript
// First of, I'm sorry for the amount of comments on this script, this script was a challenge for me, fun one for sure, but I wanted to thoroughly go through every step before making the script public
// Glad I did so because I fixed some weird things and I ended up forgetting to add the EMA into the equation so our entry signals were a mess- 1