2段階ストップロス戦略


作成日: 2023-10-25 18:11:30 最終変更日: 2023-10-25 18:11:30
コピー: 0 クリック数: 729
1
フォロー
1617
フォロワー

2段階ストップロス戦略

概要

この戦略の主な考えは,2つのストップポイントを設定し,最初のストップポイントがトリガーされたときに,ストップを入場価格に移動させ,ストップがにされるのを防ぐことです.

戦略原則

この戦略はブリン帯指数とストキャスティック指数での入場に基づいています. 価格がブリン帯を上回ったときに空白し,ストキャスティック指数が超売りを示したときに多めにします.

具体的には,戦略の入場論理は次のとおりです.

  1. 閉盤価格がブリン帯下線より低く,ストキャスティックK線がD線を横切ったときの多入場

  2. 閉盤価格がブリン帯より上線し,ストキャスティックK線がD線を横切ると空調入場

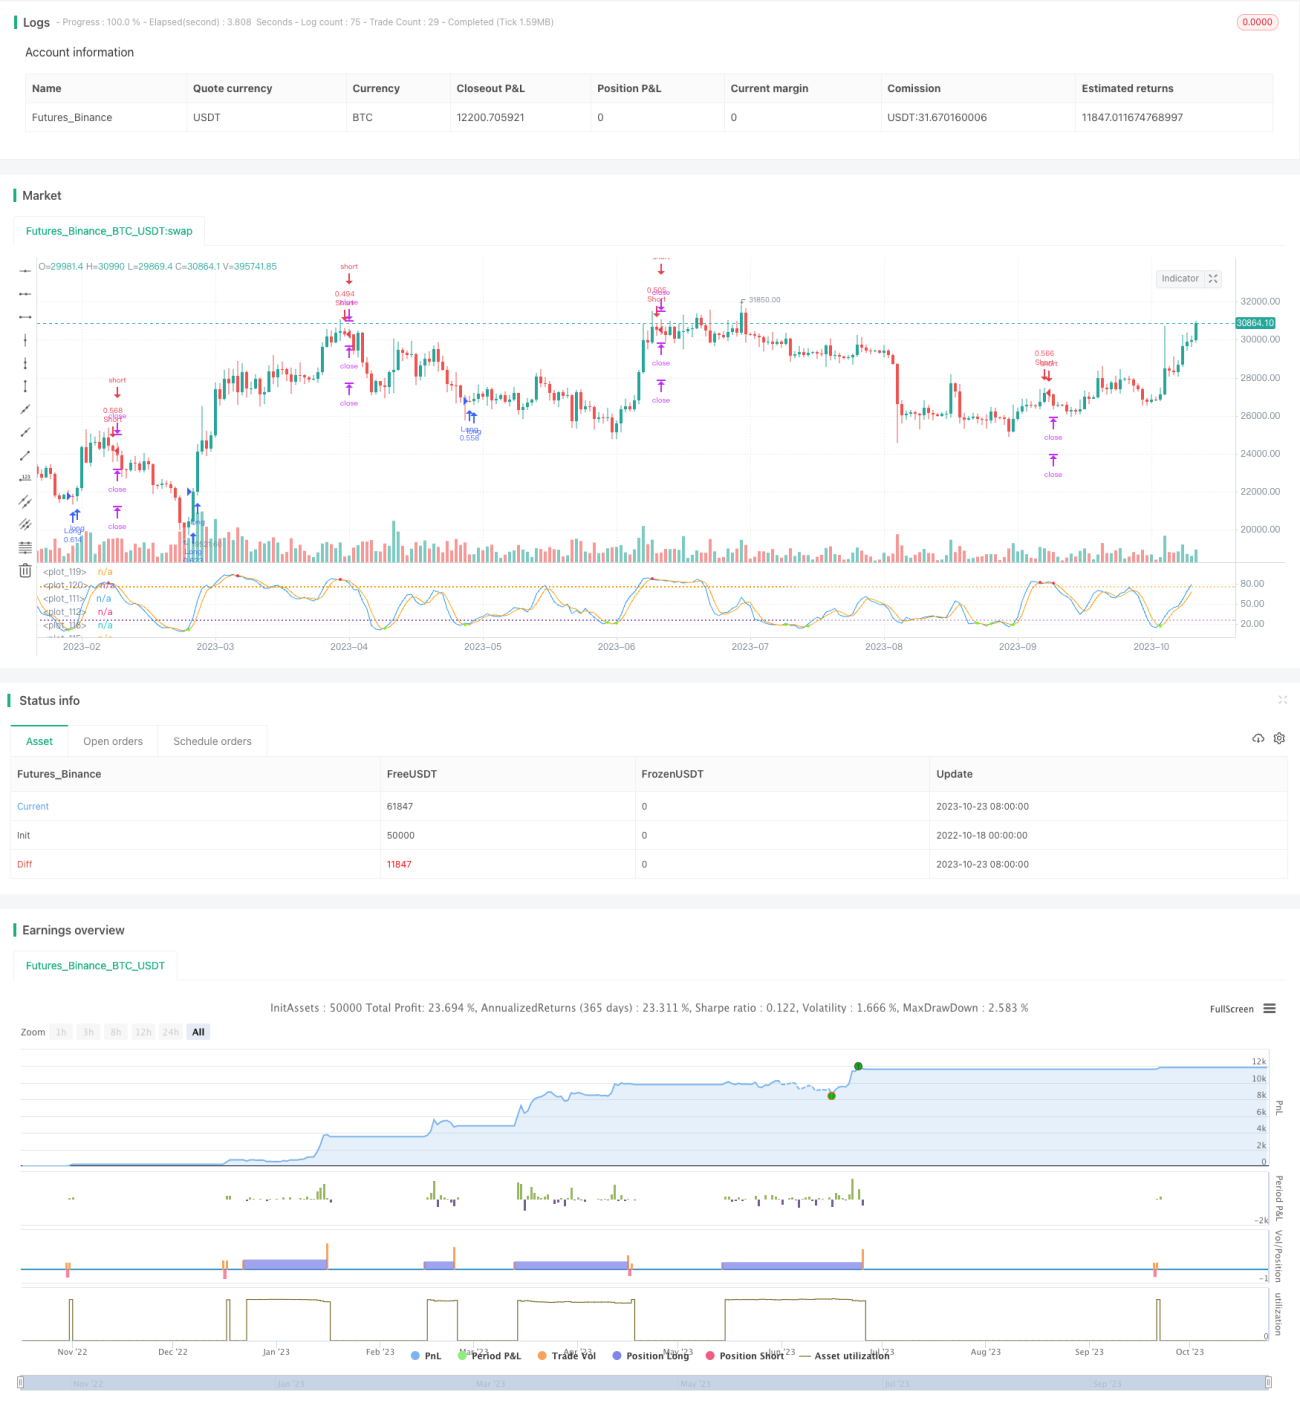
この戦略は2つのストップポイントを設定し,最初のストップポイントは200点,第2のストップポイントは500点に固定する.

価格移動の過程で最初のストップポイントが触発されたとき,この戦略はストップポイントを入場価格に移動する.このようにして,最初の段階の利益をロックし,同時にストップ損失が価格の波動のに挟まれないようにする.

ストップポイントが2つ目のストップポイントがトリガーされたとき,またはストップポイントがトリガーされたとき,この戦略は完全に平定されます.

戦略的優位性

この2段階のストップ・ストラトジーの最大の利点は,利益のロックを実現し,同時にストップ・ストラトジーを価格の波動の縁に防ぐことです. ストップ・ストラトジーを入場価格に移動することによって,ストップ・ストラトジーの縁にされる確率を減らすことができ,利益を保護できます.

もう一つの優位性は,この戦略は,価格変動の範囲を判断するブリン帯の指標と,価格変動の範囲を判断するストキャスティック指標を判断する超買い超売の組み合わせ戦略を採用していることです.この2つの指標は互いを補完し,入場率を向上させることができます.

戦略リスク

この戦略の主なリスクは,ブリン帯域指標とストキャスティック指標の両方が誤った信号を生じさせる可能性があることにある.ブリン帯域範囲を誤って計算すると,誤った入場タイミングや誤った信号が生じる.ストキャスティック指標が偽突破を生じさせると,誤った入場も生じる.

さらに,入場価格にストップポイントを移動させると,再び値が引き上げられる危険性があります. V型逆転が起こると,ストップポイントが2度目のトリガーされる可能性があります.

これらのリスクを軽減するために,ブリン帯のパラメータを調整し,ストキャスティック指標のパラメータの組み合わせを最適化し,ストップポイント間隔を適切に増加させることができます.

戦略最適化の方向性

この2段階のストップ・ローズ戦略はさらに最適化できます.

  1. 異なるパラメータの組み合わせをテストし,ブリン帯パラメータとストキャスティックパラメータを最適化して,最適なパラメータの組み合わせを見つけることができます.

  2. 異なるストップ・ストラップポイント設定をテストし,ストップ・ストラップポイントのサイズを最適化し,最適な配置を見つけることができます.

  3. 移動平均などの他の指標を添加して,入場率の正確性を高める多指標組合せ戦略を形成することができる.

  4. 異なるストップポイント移動の論理を研究することができる.例えば,入場価格ではなく,一定の距離を超えて移動する.

  5. 止損点移動の回数を増加させ,3つまたはそれ以上の段階の止損移動を設定できます.

要約する

この戦略はブリン帯指数とストキャスティック指数を用い,入場タイミングを判断し,2つのストップポイントを設定し,最初のストップポイントに達した後にストップポイントを入場価格に移動し,2段階のストップ戦略を形成する.この戦略は,利益を効果的にロックし,ストップが横に挟まれるのを防ぐことができる.戦略の優位性は顕著であるが,ある程度の改善の余地もある.パラメータ最適化,多指標組合せ,ストップポイントの論理調整などの方法によって,この戦略をさらに完善することができる.

ストラテジーソースコード
/*backtest
start: 2022-10-18 00:00:00
end: 2023-10-24 00:00:00
period: 1d
basePeriod: 1h
exchanges: [{"eid":"Futures_Binance","currency":"BTC_USDT"}]
*/

// This source code is subject to the terms of the Mozilla Public License 2.0 at https://mozilla.org/MPL/2.0/
// © fpsd4ve

//@version=5

// Add Bollinger Bands indicator (close, 20, 2) manually to visualise trading conditions
strategy("2xTP, SL to entry", 
     overlay=false,
     pyramiding=0,
     calc_on_every_tick=false,
     default_qty_type=strategy.percent_of_equity,
     default_qty_value=25,
     initial_capital=1000,
     commission_type=strategy.commission.percent,
     commission_value=0.01
     )

// PARAMETERS
// Assumes quote currency is FIAT as with BTC/USDT pair
tp1=input.float(200, title="Take Profit 1")
tp2=input.float(500, title="Take Profit 2")
sl=input.float(200, title="Stop Loss")
stOBOS = input.bool(true, title="Use Stochastic overbought/oversold threshold")

// Colors
colorRed = #FF2052
colorGreen = #66FF00


// FUNCTIONS
// Stochastic
f_stochastic() =>
    stoch = ta.stoch(close, high, low, 14)
    stoch_K = ta.sma(stoch, 3)
    stoch_D = ta.sma(stoch_K, 3)
    stRD = ta.crossunder(stoch_K, stoch_D)
    stGD = ta.crossover(stoch_K, stoch_D)
    [stoch_K, stoch_D, stRD, stGD]


// VARIABLES
[bbMiddle, bbUpper, bbLower] = ta.bb(close, 20, 2)
[stoch_K, stoch_D, stRD, stGD] = f_stochastic()


// ORDERS
// Active Orders
// Check if strategy has open positions
inLong = strategy.position_size > 0
inShort = strategy.position_size < 0
// Check if strategy reduced position size in last bar
longClose = strategy.position_size < strategy.position_size[1]
shortClose = strategy.position_size > strategy.position_size[1]

// Entry Conditions
// Enter long when during last candle these conditions are true:
// Candle high is greater than upper Bollinger Band
// Stochastic K line crosses under D line and is oversold
longCondition = stOBOS ?
     low[1] < bbLower[1] and stGD[1] and stoch_K[1] < 25 :
     low[1] < bbLower[1] and stGD[1]

// Enter short when during last candle these conditions are true:
// Candle low is lower than lower Bollinger Band
// Stochastic K line crosses over D line and is overbought
shortCondition = stOBOS ?
     high[1] > bbUpper[1] and stRD[1] and stoch_K[1] > 75 :
     high[1] > bbUpper[1] and stRD[1]

// Exit Conditions
// Calculate Take Profit 
longTP1 = strategy.position_avg_price + tp1
longTP2 = strategy.position_avg_price + tp2
shortTP1 = strategy.position_avg_price - tp1
shortTP2 = strategy.position_avg_price - tp2

// Calculate Stop Loss
// Initialise variables
var float longSL = 0.0
var float shortSL = 0.0

// When not in position, set stop loss using close price which is the price used during backtesting
// When in a position, check to see if the position was reduced on the last bar
// If it was, set stop loss to position entry price. Otherwise, maintain last stop loss value
longSL := if inLong and ta.barssince(longClose) < ta.barssince(longCondition)
    strategy.position_avg_price
else if inLong
    longSL[1]
else
    close - sl

shortSL := if inShort and ta.barssince(shortClose) < ta.barssince(shortCondition)
    strategy.position_avg_price
else if inShort
    shortSL[1]
else
    close + sl

// Manage positions
strategy.entry("Long", strategy.long, when=longCondition)
strategy.exit("TP1/SL", from_entry="Long", qty_percent=50, limit=longTP1, stop=longSL)
strategy.exit("TP2/SL", from_entry="Long", limit=longTP2, stop=longSL)

strategy.entry("Short", strategy.short, when=shortCondition)
strategy.exit("TP1/SL", from_entry="Short", qty_percent=50, limit=shortTP1, stop=shortSL)
strategy.exit("TP2/SL", from_entry="Short", limit=shortTP2, stop=shortSL)


// DRAW
// Stochastic Chart
plot(stoch_K, color=color.blue)
plot(stoch_D, color=color.orange)

// Circles
plot(stOBOS ? stRD and stoch_K >= 75 ? stoch_D : na : stRD ? stoch_D : na, color=colorRed, style=plot.style_circles, linewidth=3)
plot(stOBOS ? stGD and stoch_K <= 25 ? stoch_D : na : stGD ? stoch_K : na, color=colorGreen, style=plot.style_circles, linewidth=3)

// Levels
hline(75, linestyle=hline.style_dotted)
hline(25, linestyle=hline.style_dotted)