マルチタイムフレームの利益確定戦略


作成日: 2023-10-30 12:02:43 最終変更日: 2023-10-30 12:02:43
コピー: 1 クリック数: 708
1
フォロー
1617
フォロワー

マルチタイムフレームの利益確定戦略

概要

この戦略は,複数の時間枠の下でのストップ管理を実現することを目的としています. 戦略は,パーセンテージストップと主時間枠上の重要な価格領域ストップを同時に採用し,より精密な,より効果的なストップ管理を実現します.

戦略原則

この戦略は,まず波動のトレンド指標を導入し,指標金叉に基づいて多信号入場を行う.

ストップ・マネジメントでは,ストップ・マネジメントの2つの方法があります.

  1. パーセンテージ・ストップ: 入場価格の一定パーセントに基づいて複数のストップ価格を設定します.

  2. 多時間枠ストップ:日線と4時間線図に均線を描き,これらの均線の価格をストップ価格として取る.

ストップの百分位には,戦略が4つの異なる百分位のストップ価格を設定する.価格が各ストップ価格に触れたとき,設定された百分位で部分的に平仓する.

多時間枠のストップの場合,戦略は日線と4時間線にそれぞれ100日平均線,200日平均線を描きます. これらの平均線の価格をストップ価格として取り,価格が平仓に達すると平仓します.

さらに,ストップ・ロスの価格が設定されます. 価格がストップ・ロスの価格を下回ると,全ポジションが平定されます.

この戦略は,パーセンテージストップとマルチタイムフレームストップの組み合わせにより,より包括的で精密なストップ管理を実現しています.

戦略的優位性

  • パーセンテージストープを使用し,固定比例のストープを使用して,早すぎるストープまたは不十分なストープを避ける.

  • 多時間枠分析により,より正確なストップ価格を設定し,ストップポイントの選択を改善します.

  • の危険を減らすために,を複数層に分けて止めてください.

  • ストップ・ロスを設定し,下落のリスクを効果的にコントロールする.

  • パーセンテージストープとマルチタイムフレームストープの組み合わせにより,ストープはより包括的で精細化されています.

リスク分析

  • 百分停止はパラメータ設定に依存し,パラメータ設定が不適切であれば,停止が早すぎたり遅すぎたりする.

  • 多時間枠分析は平均線指数に依存し,平均線は一定の遅滞性があり,偏差が発生する可能性があります.

  • 止損位置の設定が不適切である場合,不必要な止損が発生する可能性があります.

  • パーセンテージストープとマルチタイムフレームストープを最適にマッチさせるための適切な最適化パラメータが必要である.

最適化の方向

  • より多くの平均線指標をテストし,より優良な平均線をキーストップ価格として選択できます.

  • モデル予測の方法が試され,価格の重要な領域をストップ価格として予測する.

  • ストップを全般的にするために,期待ストップの比率,移動ストップなど,より多くのストップの規則を導入することができます.

  • ポジションの保持期間によって最適の百分位停止パラメータをテストできます.

  • リスク・リターン・ペア比を整体的に優化するために,反省で停止パラメータを最適化できます.

要約する

この戦略は,百分停止と多時間枠停止を組み合わせて柔軟で正確な停止管理を実現する.戦略は,停止点選択が優れていること,停止がより全面的なことなどの利点がある.また,パラメータ設定,停止の位置などの問題もある.その後,停止パラメータを最適化したり,より多くの停止ルールを追加したりなどで改善することができ,戦略の停止システムをより完善にすることができる.
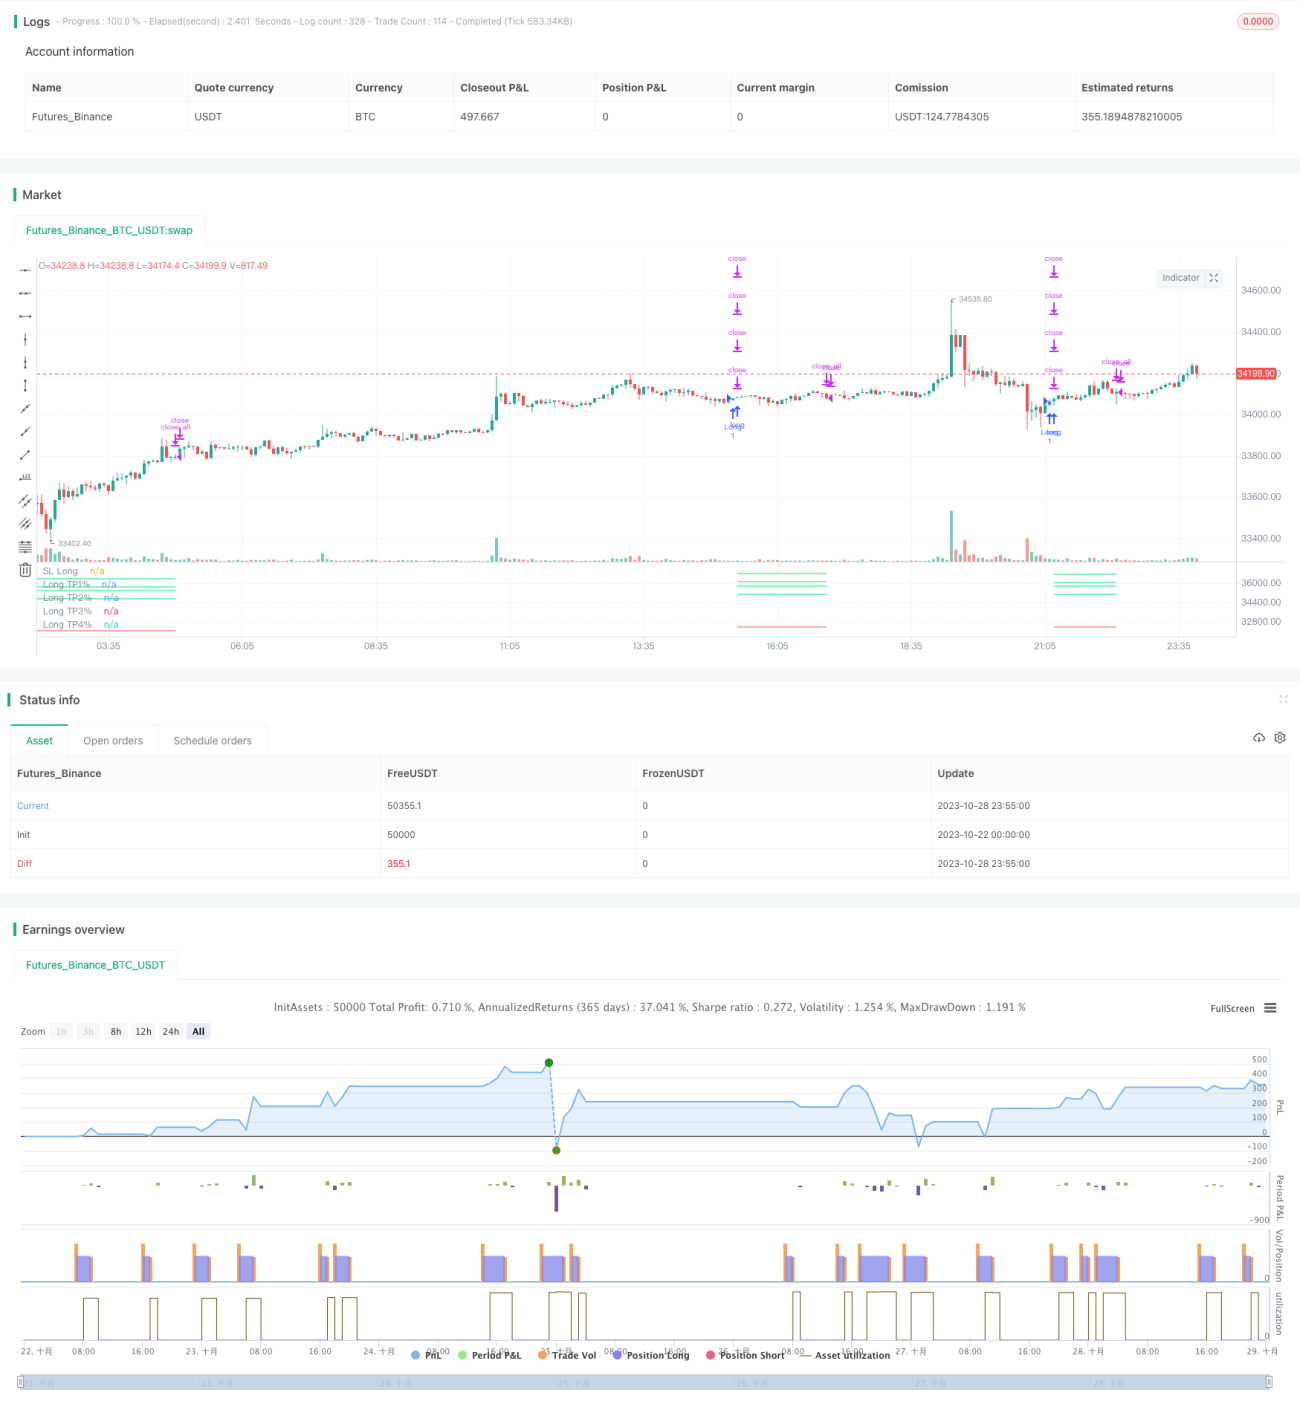
ストラテジーソースコード
/*backtest
start: 2023-10-22 00:00:00
end: 2023-10-29 00:00:00
period: 5m
basePeriod: 1m
exchanges: [{"eid":"Futures_Binance","currency":"BTC_USDT"}]
*/

// This source code is subject to the terms of the Mozilla Public License 2.0 at https://mozilla.org/MPL/2.0/
// © TrendCrypto2022
//@version=5
// strategy("Take profit Multi timeframe", overlay=true, margin_long=100, margin_short=100)
takepercent  = input.bool(title="Take profit %", defval=true ,group="Set up take profit")
takemtf  = input.bool(title="Take profit Multi timeframe", defval=false ,group="Set up take profit")

//Paste your strategy at here. This is example strategy. I use WaveTrend indicator

//WaveTrend indicator
n1 = input(10, "Channel Length")
n2 = input(21, "Average Length")
oblv1 = input(60, "Over Bought Lv 1")
oblv2 = input(53, "Over Bought Lv 2")
oslv1 = input(-60, "Over Sold Lv 1")
oslv2 = input(-53, "Over Sold Lv 2")
 
ap = hlc3 
esa = ta.ema(ap, n1)
d = ta.ema(math.abs(ap - esa), n1)
ci = (ap - esa) / (0.015 * d)
tci = ta.ema(ci, n2)
 
wt1 = tci
wt2 = ta.sma(wt1,4)

//Strategy
buy = ta.crossover(wt1, wt2) and wt1 < -40
if (buy)
    strategy.entry("Long", strategy.long)


//Resistant in time D and 4H
ema_len1 = input.int(title='Ema1', defval=100, group='Take profit Mtf')
ema_len2 = input.int(title='Ema2', defval=200, group='Take profit Mtf')
src = input.source(title='Source', defval=close, group='Take profit Mtf')
tf1 = input.timeframe(title='Time frame 1', defval='240', group='Take profit Mtf')
tf2 = input.timeframe(title='Time frame 2', defval='D', group='Take profit Mtf')
htf_ma1 = ta.ema(src, ema_len1)
htf_ma2 = ta.ema(src, ema_len2)
ema1 = request.security(syminfo.tickerid, tf1, htf_ma1)
ema2 = request.security(syminfo.tickerid, tf1, htf_ma2)
ema3 = request.security(syminfo.tickerid, tf2, htf_ma1)
ema4 = request.security(syminfo.tickerid, tf2, htf_ma2)

//Plot
plotema1 = plot(ema1, color=color.new(color.silver, 0), style=plot.style_line, linewidth=1, offset=0, title='Ema100 4h', display=display.none)
plotema2 = plot(ema2, color=color.new(color.silver, 0), style=plot.style_line, linewidth=1, offset=0, title='Ema200 4h', display=display.none)
plotema3 = plot(ema3, color=color.new(color.orange, 20), style=plot.style_line, linewidth=1, offset=0, title='Ema100 D', display=display.none)
plotema4 = plot(ema4, color=color.new(color.orange, 20), style=plot.style_line, linewidth=1, offset=0, title='Ema200 D', display=display.none)

//Label take profit multitime frame
var label labelema1 = na
label.delete(labelema1)
labelema1 := label.new(x=time + 120, y=ema1, text='\n*****Ema100 4H: ' + str.tostring(math.round(ema1,4)) + '', color=color.new(#000000, 100), textcolor =  color.yellow, size=size.small, style=label.style_label_left, xloc=xloc.bar_time, yloc=yloc.price)

var label labelema2 = na
label.delete(labelema2)
labelema2 := label.new(x=time + 120, y=ema2, text='\n*****Ema200 4H: ' + str.tostring(math.round(ema2,4)) + '', color=color.new(#000000, 100), textcolor = color.yellow, size=size.small, style=label.style_label_left, xloc=xloc.bar_time, yloc=yloc.price)

var label labelema3 = na
label.delete(labelema3)
labelema3 := label.new(x=time + 120, y=ema3, text='\n*****Ema100 1D: ' + str.tostring(math.round(ema3,4)) + '', color=color.new(#000000, 100), textcolor = color.yellow, size=size.small, style=label.style_label_left, xloc=xloc.bar_time, yloc=yloc.price)

var label labelema4 = na
label.delete(labelema4)
labelema4 := label.new(x=time + 120, y=ema4, text='\n*****Ema200 1D: ' + str.tostring(math.round(ema4,4)) + '', color=color.new(#000000, 100), textcolor = color.yellow, size=size.small, style=label.style_label_left, xloc=xloc.bar_time, yloc=yloc.price)

//Set up take profit %
percent(pcnt) =>
    strategy.position_size != 0 ? math.round(pcnt / 100 * strategy.position_avg_price / syminfo.mintick) : float(na)
TP1=input.float(3, title="TP1 %", step=0.1, group="Take profit %")
TP2=input.float(5, title="TP2 %", step=1, group="Take profit %")
TP3=input.float(6, title="TP3 %", step=1, group="Take profit %")
TP4=input.float(8, title="TP4 %", step=1, group="Take profit %")

SL=input.float(5, title="Stop Loss %", step=1, group="Take profit %")
qty1=input.float(5, title="% Close At TP1", step=1, group="Take profit %")
qty2=input.float(5, title="% Close At TP2", step=1, group="Take profit %")
qty3=input.float(5, title="% Close At TP3", step=1, group="Take profit %")
qty4=input.float(5, title="% Close At TP4", step=1, group="Take profit %")
lossPnt_L = percent(SL)

//Set up take profit multi timeframe
a = array.from((ema1), (ema2), (ema3), (ema4))
tpmtf1 = array.min(a)
tpmtf2 = array.min(a, 2)
tpmtf3 = array.min(a, 3)
tpmtf4 = array.min(a, 4)
//Set up exit
long_sl_level = strategy.position_avg_price - lossPnt_L*syminfo.mintick
if takepercent == true
    strategy.exit("TP1%", "Long", qty_percent = qty1, profit = percent(TP1), loss = lossPnt_L)
    strategy.exit("TP2%", "Long", qty_percent = qty2, profit = percent(TP2), loss = lossPnt_L)
    strategy.exit("TP3%", "Long", qty_percent = qty3, profit = percent(TP3), loss = lossPnt_L)
    strategy.exit("TP4%", "Long", qty_percent = qty4, profit = percent(TP3), loss = lossPnt_L)
    strategy.close_all(when= ta.crossunder(wt1, wt2) and wt1 > 0, comment="Close All")


if takemtf == true and array.max(a, 1) > strategy.position_avg_price
    strategy.exit("TP1Mtf", "Long", qty_percent = qty1, limit = tpmtf1, stop = long_sl_level)
    strategy.exit("TP2Mtf", "Long", qty_percent = qty2, limit = tpmtf2, stop = long_sl_level)
    strategy.exit("TP3Mtf", "Long", qty_percent = qty3, limit = tpmtf3, stop = long_sl_level)
    strategy.close_all(when= ta.crossunder(wt1, wt2) and wt1 > 0, comment="Close All")

// Plot TP & SL
long_tp1_level = strategy.position_avg_price + percent(TP1)*syminfo.mintick
long_tp2_level = strategy.position_avg_price + percent(TP2)*syminfo.mintick
long_tp3_level = strategy.position_avg_price + percent(TP3)*syminfo.mintick
long_tp4_level = strategy.position_avg_price + percent(TP4)*syminfo.mintick

plot(strategy.position_size > 0 ? long_sl_level : na, color=color.red, style=plot.style_linebr, title="SL Long")

plot(strategy.position_size > 0 ? long_tp1_level : na, color=color.lime, style=plot.style_linebr, title="Long TP1%")
plot(strategy.position_size > 0 ? long_tp2_level : na, color=color.lime, style=plot.style_linebr, title="Long TP2%")
plot(strategy.position_size > 0 ? long_tp3_level : na, color=color.lime, style=plot.style_linebr, title="Long TP3%")
plot(strategy.position_size > 0 ? long_tp4_level : na, color=color.lime, style=plot.style_linebr, title="Long TP4%")

plot(strategy.position_size > 0 ? tpmtf1 : na, color=color.orange, style=plot.style_linebr, title="Long TP1Mtf", display = display.none)
plot(strategy.position_size > 0 ? tpmtf2 : na, color=color.orange, style=plot.style_linebr, title="Long TP2Mtf", display = display.none)
plot(strategy.position_size > 0 ? tpmtf3 : na, color=color.orange, style=plot.style_linebr, title="Long TP3Mtf", display = display.none)

//Label TP
if strategy.position_size > 0
    var label labellongtp1 = na
    label.delete(labellongtp1)
    labellongtp1 := label.new(x=time + 120, y=long_tp1_level, text='\nTP1: ' + str.tostring(math.round(long_tp1_level,2)) + '', color=color.new(#000000, 100), textcolor = color.lime, size=size.small, style=label.style_label_left, xloc=xloc.bar_time, yloc=yloc.price)
     
    var label labellongtp2 = na
    label.delete(labellongtp2)
    labellongtp2 := label.new(x=time + 120, y=long_tp2_level, text='\nTP2: ' + str.tostring(math.round(long_tp2_level,2)) + '', color=color.new(#000000, 100), textcolor = color.lime, size=size.small, style=label.style_label_left, xloc=xloc.bar_time, yloc=yloc.price)
     
    var label labellongtp3 = na
    label.delete(labellongtp3)
    labellongtp3 := label.new(x=time + 120, y=long_tp3_level, text='\nTP3: ' + str.tostring(math.round(long_tp3_level,2)) + '', color=color.new(#000000, 100), textcolor = color.lime, size=size.small, style=label.style_label_left, xloc=xloc.bar_time, yloc=yloc.price)
        
    var label labellongtp4 = na
    label.delete(labellongtp4)
    labellongtp4 := label.new(x=time + 120, y=long_tp4_level, text='\nTP4: ' + str.tostring(math.round(long_tp4_level,2)) + '', color=color.new(#000000, 100), textcolor = color.lime, size=size.small, style=label.style_label_left, xloc=xloc.bar_time, yloc=yloc.price)