
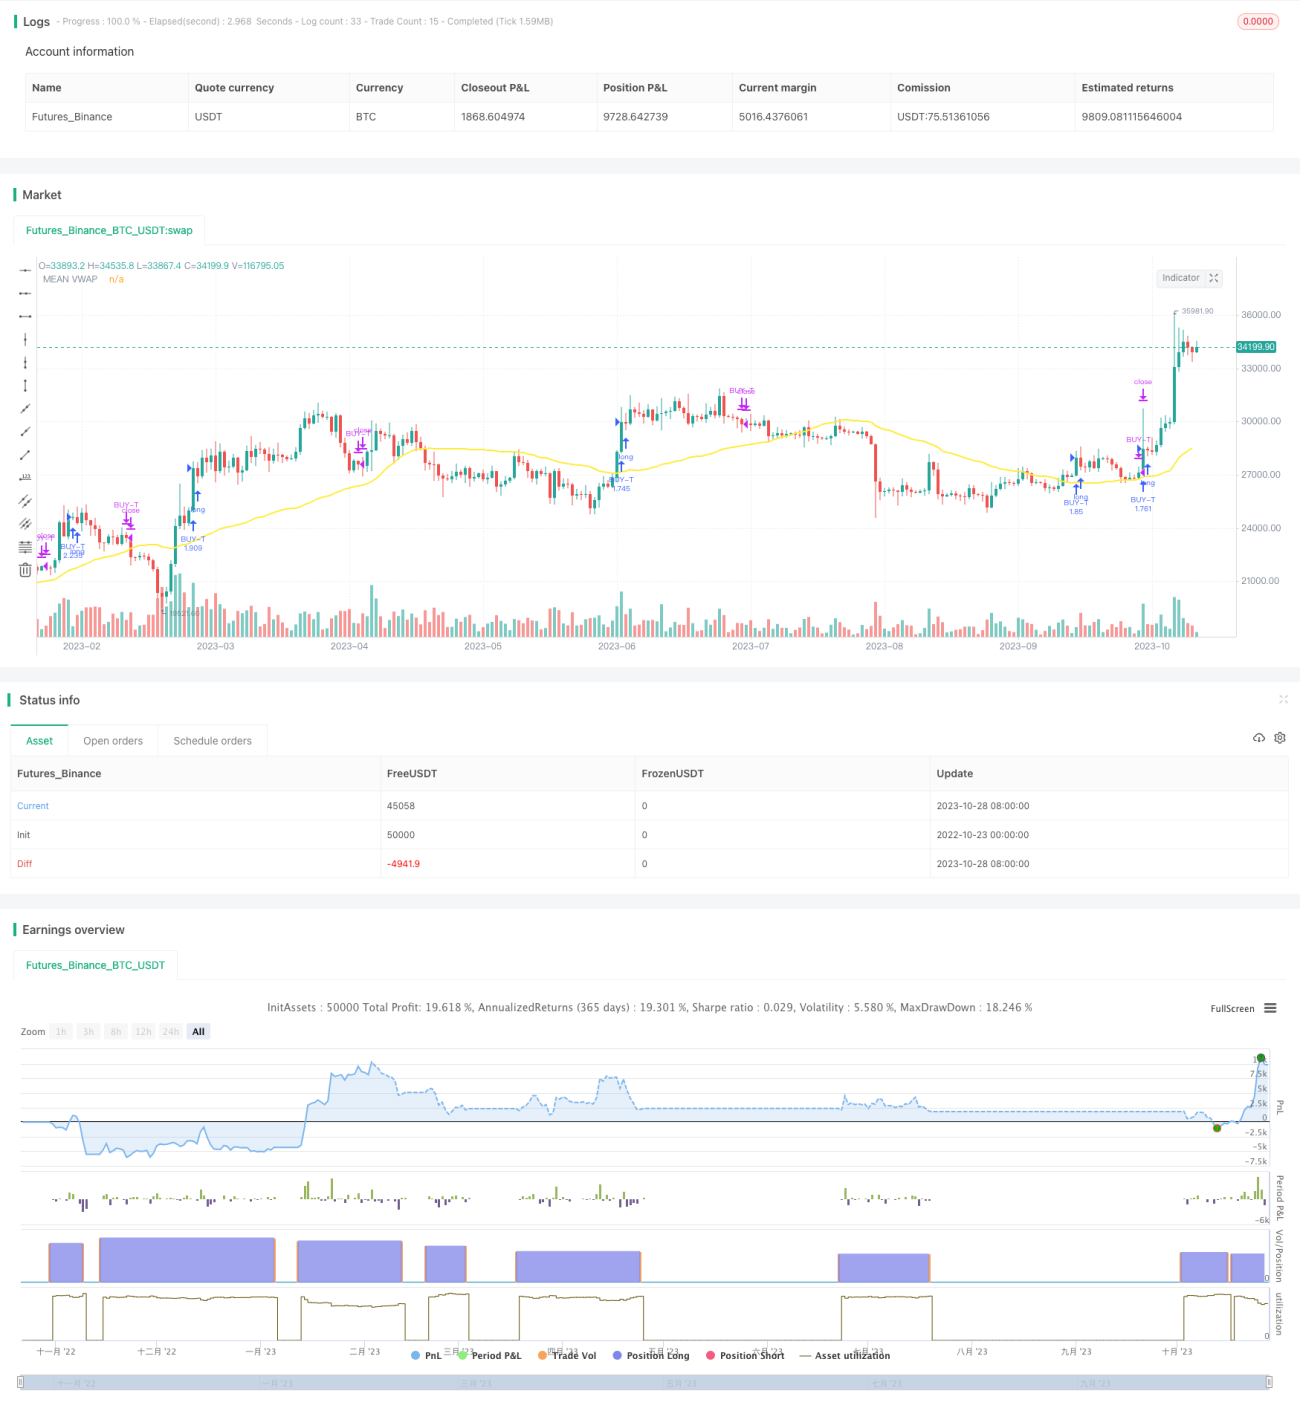
この戦略は,主に均線交差原理を利用し,RSI指標の反転信号と組み合わせ,カスタマイズされた二線追跡アルゴリズムを使用して均線交差追跡取引を実現する.戦略は,2つの異なる周期の均線交差を追跡する.急速な均線は短期トレンドを追跡し,他の遅い均線は長期トレンドを追跡する.急速な均線が遅い均線を上を横切るときは,短期トレンドを上方へ表示し,購入することができます.急速な平均線が遅い平均線を横切るときは,短期トレンドが終了し,平仓する必要があります.
長期トレンドと短期トレンドを表す2つの異なるパラメータのVWAP平均線を計算する
2組の天幕線と基準線の平均値を分別,遅い平均線と速い平均線として取る
ブリン帯の指標を計算して,収束と突破を判断する
取引量エネルギー判断のためのTSV指標の計算
RSIの指標を計算して 超買いと超売りを判断する
応募条件:
出場条件:
長期・短期トレンドを同時に捉える 2 つの均線システム
RSI指数は,超買区に買い入りを避け,超売り区に売り出しています.
TSV指数は,十分な取引量があることを保証する.
ブリン帯の重要な突破点
複数の指標の組み合わせにより,偽突破を効果的にフィルターできます.
均線システムは誤信号を発生しやすいため,補助指標フィルタが必要である.
RSIのパラメータは最適化が必要で,そうでなければ,買い値と売り値を見逃す可能性があります.
TSV指標はパラメータにも敏感で,慎重にテストする必要があります.
ブリン・ベールへの突破は偽突破であり,検証が必要である.
多指標組合せ,パラメータ最適化が難しい,過度に最適化が容易
トレーニングとテストのデータ不足が曲線適合につながる
より多くの周期パラメータをテストし,最適なパラメータの組み合わせを探します.
MACD,KDの代替,RSIの組み合わせなど
ウォークフォワード分析を最大限に活用するパラメータ最適化
単一損失を抑えるために ストップ・ストップ戦略を追加する
機械学習モデルの補助信号判断を考慮する
単一のパラメータの組み合わせに過度に依存しないように,異なる市場に対してパラメータを調整する
この戦略は,双均線システムを使用して,長短トレンドを捕捉し,RSI,TSV,ブリン帯などの複数の指標のフィルター信号を使用する.戦略の利点は,順番的に,長期の上昇の波を捕捉することができる.しかし,一定の偽信号のリスクもある.
/*backtest
start: 2022-10-23 00:00:00
end: 2023-10-29 00:00:00
period: 1d
basePeriod: 1h
exchanges: [{"eid":"Futures_Binance","currency":"BTC_USDT"}]
*/
// @version=4
// Credits
// "Vwap with period" code which used in this strategy to calculate the leadLine was written by "neolao" active on https://tr.tradingview.com/u/neolao/
// "TSV" code which used in this strategy was written by "liw0" active on https://www.tradingview.com/u/liw0. The code is corrected by "vitelot" December 2018.
// "Vidya" code which used in this strategy was written by "everget" active on https://tr.tradingview.com/u/everget/
strategy("HYE Combo Market [Strategy] (Vwap Mean Reversion + Trend Hunter)", overlay = true, initial_capital = 1000, default_qty_value = 100, default_qty_type = strategy.percent_of_equity, commission_value = 0.025)
//Strategy inputs
source = input(title = "Source", defval = close, group = "Mean Reversion Strategy Inputs")
smallcumulativePeriod = input(title = "Small VWAP", defval = 8, group = "Mean Reversion Strategy Inputs")
bigcumulativePeriod = input(title = "Big VWAP", defval = 10, group = "Mean Reversion Strategy Inputs")
meancumulativePeriod = input(title = "Mean VWAP", defval = 50, group = "Mean Reversion Strategy Inputs")
percentBelowToBuy = input(title = "Percent below to buy %", defval = 2, group = "Mean Reversion Strategy Inputs")
rsiPeriod = input(title = "Rsi Period", defval = 2, group = "Mean Reversion Strategy Inputs")
rsiEmaPeriod = input(title = "Rsi Ema Period", defval = 5, group = "Mean Reversion Strategy Inputs")
rsiLevelforBuy = input(title = "Maximum Rsi Level for Buy", defval = 30, group = "Mean Reversion Strategy Inputs")
slowtenkansenPeriod = input(9, minval=1, title="Slow Tenkan Sen VWAP Line Length", group = "Trend Hunter Strategy Inputs")
slowkijunsenPeriod = input(13, minval=1, title="Slow Kijun Sen VWAP Line Length", group = "Trend Hunter Strategy Inputs")
fasttenkansenPeriod = input(3, minval=1, title="Fast Tenkan Sen VWAP Line Length", group = "Trend Hunter Strategy Inputs")
fastkijunsenPeriod = input(7, minval=1, title="Fast Kijun Sen VWAP Line Length", group = "Trend Hunter Strategy Inputs")
BBlength = input(20, minval=1, title= "Bollinger Band Length", group = "Trend Hunter Strategy Inputs")
BBmult = input(2.0, minval=0.001, maxval=50, title="Bollinger Band StdDev", group = "Trend Hunter Strategy Inputs")
tsvlength = input(20, minval=1, title="TSV Length", group = "Trend Hunter Strategy Inputs")
tsvemaperiod = input(7, minval=1, title="TSV Ema Length", group = "Trend Hunter Strategy Inputs")
length = input(title="Vidya Length", type=input.integer, defval=20, group = "Trend Hunter Strategy Inputs")
src = input(title="Vidya Source", type=input.source, defval= hl2 , group = "Trend Hunter Strategy Inputs")
// Vidya Calculation
getCMO(src, length) =>
mom = change(src)
upSum = sum(max(mom, 0), length)
downSum = sum(-min(mom, 0), length)
out = (upSum - downSum) / (upSum + downSum)
out
cmo = abs(getCMO(src, length))
alpha = 2 / (length + 1)
vidya = 0.0
vidya := src * alpha * cmo + nz(vidya[1]) * (1 - alpha * cmo)
// Make input options that configure backtest date range
startDate = input(title="Start Date", type=input.integer,
defval=1, minval=1, maxval=31, group = "Strategy Date Range")
startMonth = input(title="Start Month", type=input.integer,
defval=1, minval=1, maxval=12, group = "Strategy Date Range")
startYear = input(title="Start Year", type=input.integer,
defval=2000, minval=1800, maxval=2100, group = "Strategy Date Range")
endDate = input(title="End Date", type=input.integer,
defval=31, minval=1, maxval=31, group = "Strategy Date Range")
endMonth = input(title="End Month", type=input.integer,
defval=12, minval=1, maxval=12, group = "Strategy Date Range")
endYear = input(title="End Year", type=input.integer,
defval=2021, minval=1800, maxval=2100, group = "Strategy Date Range")
inDateRange = true
// Mean Reversion Strategy Calculation
typicalPriceS = (high + low + close) / 3
typicalPriceVolumeS = typicalPriceS * volume
cumulativeTypicalPriceVolumeS = sum(typicalPriceVolumeS, smallcumulativePeriod)
cumulativeVolumeS = sum(volume, smallcumulativePeriod)
smallvwapValue = cumulativeTypicalPriceVolumeS / cumulativeVolumeS
typicalPriceB = (high + low + close) / 3
typicalPriceVolumeB = typicalPriceB * volume
cumulativeTypicalPriceVolumeB = sum(typicalPriceVolumeB, bigcumulativePeriod)
cumulativeVolumeB = sum(volume, bigcumulativePeriod)
bigvwapValue = cumulativeTypicalPriceVolumeB / cumulativeVolumeB
typicalPriceM = (high + low + close) / 3
typicalPriceVolumeM = typicalPriceM * volume
cumulativeTypicalPriceVolumeM = sum(typicalPriceVolumeM, meancumulativePeriod)
cumulativeVolumeM = sum(volume, meancumulativePeriod)
meanvwapValue = cumulativeTypicalPriceVolumeM / cumulativeVolumeM
rsiValue = rsi(source, rsiPeriod)
rsiEMA = ema(rsiValue, rsiEmaPeriod)
buyMA = ((100 - percentBelowToBuy) / 100) * bigvwapValue[0]
inTrade = strategy.position_size > 0
notInTrade = strategy.position_size <= 0
if(crossunder(smallvwapValue, buyMA) and rsiEMA < rsiLevelforBuy and close < meanvwapValue and inDateRange and notInTrade)
strategy.entry("BUY-M", strategy.long)
if(close > meanvwapValue or not inDateRange)
strategy.close("BUY-M")
// Trend Hunter Strategy Calculation
// Slow Tenkan Sen Calculation
typicalPriceTS = (high + low + close) / 3
typicalPriceVolumeTS = typicalPriceTS * volume
cumulativeTypicalPriceVolumeTS = sum(typicalPriceVolumeTS, slowtenkansenPeriod)
cumulativeVolumeTS = sum(volume, slowtenkansenPeriod)
slowtenkansenvwapValue = cumulativeTypicalPriceVolumeTS / cumulativeVolumeTS
// Slow Kijun Sen Calculation
typicalPriceKS = (high + low + close) / 3
typicalPriceVolumeKS = typicalPriceKS * volume
cumulativeTypicalPriceVolumeKS = sum(typicalPriceVolumeKS, slowkijunsenPeriod)
cumulativeVolumeKS = sum(volume, slowkijunsenPeriod)
slowkijunsenvwapValue = cumulativeTypicalPriceVolumeKS / cumulativeVolumeKS
// Fast Tenkan Sen Calculation
typicalPriceTF = (high + low + close) / 3
typicalPriceVolumeTF = typicalPriceTF * volume
cumulativeTypicalPriceVolumeTF = sum(typicalPriceVolumeTF, fasttenkansenPeriod)
cumulativeVolumeTF = sum(volume, fasttenkansenPeriod)
fasttenkansenvwapValue = cumulativeTypicalPriceVolumeTF / cumulativeVolumeTF
// Fast Kijun Sen Calculation
typicalPriceKF = (high + low + close) / 3
typicalPriceVolumeKF = typicalPriceKS * volume
cumulativeTypicalPriceVolumeKF = sum(typicalPriceVolumeKF, fastkijunsenPeriod)
cumulativeVolumeKF = sum(volume, fastkijunsenPeriod)
fastkijunsenvwapValue = cumulativeTypicalPriceVolumeKF / cumulativeVolumeKF
// Slow LeadLine Calculation
lowesttenkansen_s = lowest(slowtenkansenvwapValue, slowtenkansenPeriod)
highesttenkansen_s = highest(slowtenkansenvwapValue, slowtenkansenPeriod)
lowestkijunsen_s = lowest(slowkijunsenvwapValue, slowkijunsenPeriod)
highestkijunsen_s = highest(slowkijunsenvwapValue, slowkijunsenPeriod)
slowtenkansen = avg(lowesttenkansen_s, highesttenkansen_s)
slowkijunsen = avg(lowestkijunsen_s, highestkijunsen_s)
slowleadLine = avg(slowtenkansen, slowkijunsen)
// Fast LeadLine Calculation
lowesttenkansen_f = lowest(fasttenkansenvwapValue, fasttenkansenPeriod)
highesttenkansen_f = highest(fasttenkansenvwapValue, fasttenkansenPeriod)
lowestkijunsen_f = lowest(fastkijunsenvwapValue, fastkijunsenPeriod)
highestkijunsen_f = highest(fastkijunsenvwapValue, fastkijunsenPeriod)
fasttenkansen = avg(lowesttenkansen_f, highesttenkansen_f)
fastkijunsen = avg(lowestkijunsen_f, highestkijunsen_f)
fastleadLine = avg(fasttenkansen, fastkijunsen)
// BBleadLine Calculation
BBleadLine = avg(fastleadLine, slowleadLine)
// Bollinger Band Calculation
basis = sma(BBleadLine, BBlength)
dev = BBmult * stdev(BBleadLine, BBlength)
upper = basis + dev
lower = basis - dev
// TSV Calculation
tsv = sum(close>close[1]?volume*(close-close[1]):close<close[1]?volume*(close-close[1]):0,tsvlength)
tsvema = ema(tsv, tsvemaperiod)
// Rules for Entry & Exit
if(fastleadLine > fastleadLine[1] and slowleadLine > slowleadLine[1] and tsv > 0 and tsv > tsvema and close > upper and close > vidya and inDateRange and notInTrade)
strategy.entry("BUY-T", strategy.long)
if((fastleadLine < fastleadLine[1] and slowleadLine < slowleadLine[1]) or not inDateRange)
strategy.close("BUY-T")
// Plots
plot(meanvwapValue, title="MEAN VWAP", linewidth=2, color=color.yellow)
//plot(vidya, title="VIDYA", linewidth=2, color=color.green)
//colorsettingS = input(title="Solid Color Slow Leadline", defval=false, type=input.bool)
//plot(slowleadLine, title = "Slow LeadLine", color = colorsettingS ? color.aqua : slowleadLine > slowleadLine[1] ? color.green : color.red, linewidth=3)
//colorsettingF = input(title="Solid Color Fast Leadline", defval=false, type=input.bool)
//plot(fastleadLine, title = "Fast LeadLine", color = colorsettingF ? color.orange : fastleadLine > fastleadLine[1] ? color.green : color.red, linewidth=3)
//p1 = plot(upper, "Upper BB", color=#2962FF)
//p2 = plot(lower, "Lower BB", color=#2962FF)
//fill(p1, p2, title = "Background", color=color.blue)
//plot(smallvwapValue, color=#13C425, linewidth=2)
//plot(bigvwapValue, color=#CA1435, linewidth=2)