
概要
超1戦略は,超1指標に基づいて取引決定を行うトレンド取引戦略である.この戦略は,超1指標の変換線,基準線,およびクラウド帯の関係を用いて,現在のトレンドの方向を判断し,価格の反転と組み合わせて入場を行う.
超1戦略は中長線のトレンド取引に主に適用され,より大きなトレンドで利益を得ることができます.この戦略は,強力なトレンド認識能力を持っています.
戦略原則
超1戦略は,取引の方向性を決定する際,以下の要素を考慮します.
-
**変換線と基準線の関係:**線が上がると<unk>,下がると<unk>です.
-
**雲帯の色:**雲帯が緑になると<unk>,赤になると<unk>
-
**価格の調整:**価格の逆転線と基準線以外での入場が必要
具体的には,戦略の取引シグナルは以下の通りです.
信号を多発する:
- 変換線は基準線より高い
- 価格が転換線と基準線より高い
- 変換線と基準線が雲帯より高い
- 価格が転換線と基準線を下回る
飛行機が空っぽになる
- 変換線は基準線より低い
- 価格が転換線と基準線を下回る
- 変換線と基準線は雲帯以下
- 価格の逆戻り 変換線と基準線以上
同時に多/空の信号が満たされると,ポジション状況に応じてポジション開設操作を行う.
優位分析
超1戦略の利点は以下の通りです.
-
超1指標の組み合わせを使用してトレンドの方向を判断し,高い精度
-
変換線と基準線は中短期トレンドを明確に判断し,雲帯は長期トレンドを判断する
-
条件は,偽の突破による損失を回避するために,価格が回転線を戻すことを要求します.
-
リスク管理は,単一の損失を効果的に制御するために,最新の最高最低価格を設定します.
-
安定した利益を追求する
-
異なる周期で適用され,中長線トレンド取引に適しています.
-
戦略は明確でわかりやすく,パラメータの最適化には広い空間があります.
-
複数の市場環境でうまく働く
リスク分析
超1戦略には以下のリスクもあります.
-
変動する市場では,止損が頻繁に発生し,利益に影響を及ぼす可能性があります.
-
トレンドが急激に変化するときに,タイミングで逆転できないことが,損失をもたらす可能性があります.
-
設定された<unk>減比は,すべての品種に適していないので,異なる基準に合わせてパラメータを調整する必要があります.
-
雲帯を突破した後に上昇するスペースが限られている場合,利益は限られている可能性があります.
-
指標パラメータは,繰り返しテストを最適化する必要があり,パラメータを頻繁に調整する品種には適していません.
リスクは以下の方法で軽減できます
-
異なる周期と品種特性をより適合させるための最適化パラメータ
-
他の指標と組み合わせて,入場シグナルをフィルタリングし,波動的な市場での偽ブレイクを避ける
-
ストップを動的に調整し,ストップがトリガーされる確率を下げる
-
試行錯誤の設定をテストする
-
グラフ形状などの方法を使用してトレンド信号の強さを決定する
最適化の方向
超1戦略は以下の点で最適化できます.
-
変換線と基準線のパラメータを最適化して,取引されている品種の特性に適合させる
-
雲帯のパラメータを最適化して,雲帯の長期トレンドの判断をより正確にする
-
ATRによる停止設定または動的な停止などの最適化ストップアルゴリズム
-
他の指標と組み合わせた信号フィルタリング,より多くのフィルタリング条件を配置し,誤入場の可能性を減らす
-
負対比の設定を最適化し,異なる品種と周期上の特性を戦略に適応する
-
マーティンガルの方法でポジションを管理し,異なる市場変動の頻度に対応する
-
機械学習によるパラメータの最適化により,より高い安定性を実現
-
異なる取引時間帯を設定し,夜間および間盤の市場特性を調整します.
要約する
超1戦略は全体的に中長線トレンド取引に適した戦略である.超1指標を用いてトレンドの方向性を判断する優位性は明らかであり,価格の回調を組み合わせて入場を行うことで誤入場を効果的に回避することができる.最適化パラメータ設定により,戦略は,より多くの品種とより多くの周期で安定した収益を達成することができる.この戦略は,理解が容易であり,大きな最適化スペースがあり,戦略研究と学習の基礎戦略の1つとして適している.
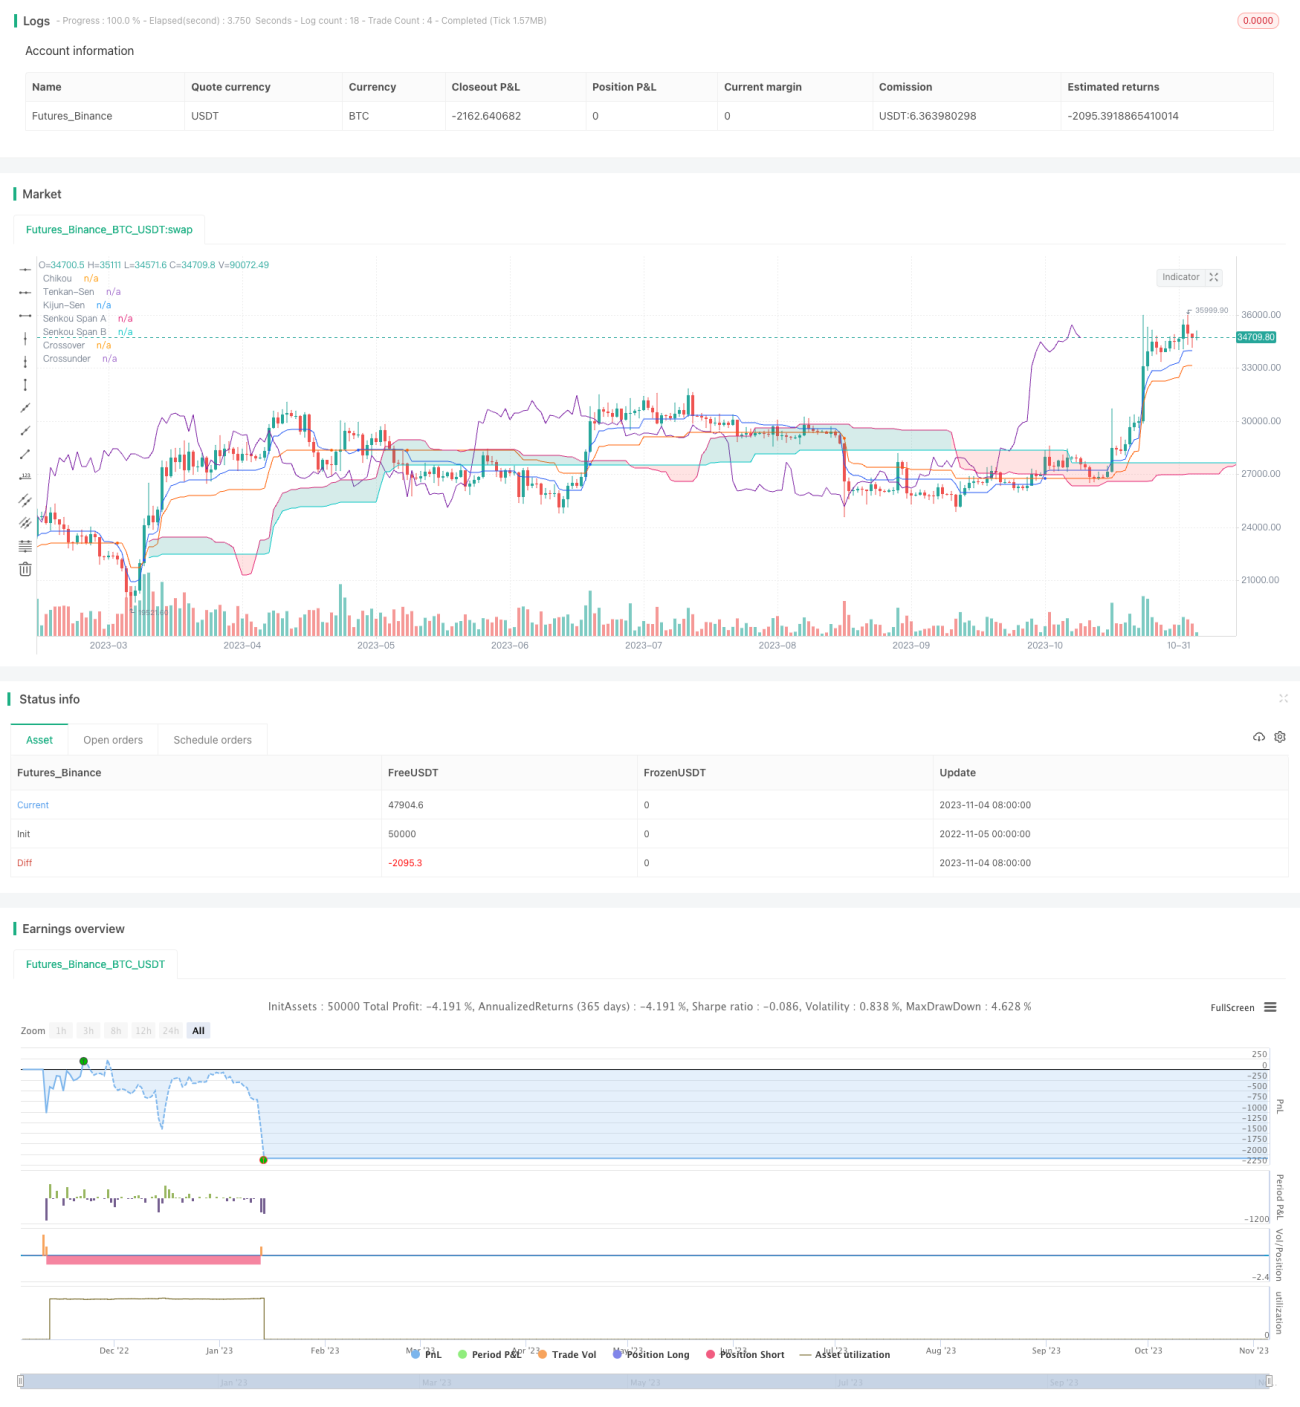
/*backtest
start: 2022-11-05 00:00:00
end: 2023-11-05 00:00:00
period: 1d
basePeriod: 1h
exchanges: [{"eid":"Futures_Binance","currency":"BTC_USDT"}]
*/

// Strategy based on the the SuperIchi indicator.
//
// Strategy was designed for the purpose of back testing.
// See strategy documentation for info on trade entry logic.- 1