内部ゲインストップに基づくロングショートモメンタムブレイクアウト戦略

概要
この戦略は,異常な上昇のK線を識別して,現在の市場に突発的な一方的な動きがあるかどうかを判断する.異常な上昇のK線を識別すると,このK線の高点の近くで買取停止命令を設定し,以前のK線の低点の近くで止損命令を設定し,高レバレッジのリスクコントロールを形成する.戦略は,止損ラインをリアルタイムで監視し,価格が止損ラインを下に突破した場合,単一の損失を直ちに撤回する.
戦略原則
この策略は,K線が形成される異常な上昇を判断し,close>openとhigh<highの出現を判断する.[1] とlow>low[1]のK線において,現在の周期異常上昇状況があると考える.このとき,長い単一の入場信号が設定され,入場価格は現在のK線の最高価格の近くにある.同時に,上方のK線の最低価格の近くにあるというストップ・ロスの価格が設定され,高レバレッジのリスクコントロールモデルが形成される.継続的に価格を監視することで,ストップ・ロスの線を突破した状況を実現する.
優位分析
この戦略の最大の利点は,市場の短線異常突発的な状況を捕捉することができ,超高周波取引を実現することである.同時に,より大きな止損幅を設定することにより,高いレバレッジを使用してリスク制御取引を行うことができ,それによってより大きな利益を得ることができる.さらに,戦略は,止損ラインを自動的に監視することを実現し,価格が下向きに止損ラインを破るとき,取引リスクを迅速に止めて効果的に制御することができる.
リスク分析
この戦略の主なリスクは,異常上昇判断が不正確であり,市場における突発的な動きを効果的に捕捉することができないことであり,取引信号の誤判の可能性が高いことにある.さらに,止損位置の設定は,取引リスクと収益にも大きな影響を与える.止まりがあまりにも緩やかであれば,取引損失のリスクが増加し,止まりがあまりにも狭い場合は,動きの利益を効果的に追跡することができないかもしれない.大量にリターンで止損位置を最適化する必要があります.
最適化の方向
この戦略は以下の点で最適化できます.
-
異常上昇判断基準は,より多くの指標や深度学習モデルによる補助判断を導入し,戦略取引信号判断の正確性を向上させることができます.
-
ストップ・ローズ・ポジション設定は,取引リスクと利益のレベルをバランスさせるのに最適なストップ・ローズ・ポジションを見つけるために,大量の統計的および最適化分析を行うことができます.
-
取引量フィルター,区間突破検証などの高周波取引風力制御の導入により,監禁の可能性を回避できます.
-
戦略の入場基準は調整可能であり,異常上昇K線に限定される必要はありません.より多くの指標とモデルを組み合わせて判定することができ,複数の検証機構を形成します.
要約する
この戦略は,全体として,典型的な高周波取引戦略であり,ショートライン突破型の戦略である.これは,市場の突然の異常な変動を捕捉することによって,超高周波取引を実現する.同時に,損失リスク制御と高レバレッジメカニズムを使用してリスクを制御する.この戦略の最適化スペースは大きく,複数の角度から調整と最適化が可能で,最終目標は,リスクを制御した前提で,より高い超高周波取引収益を得ることである.
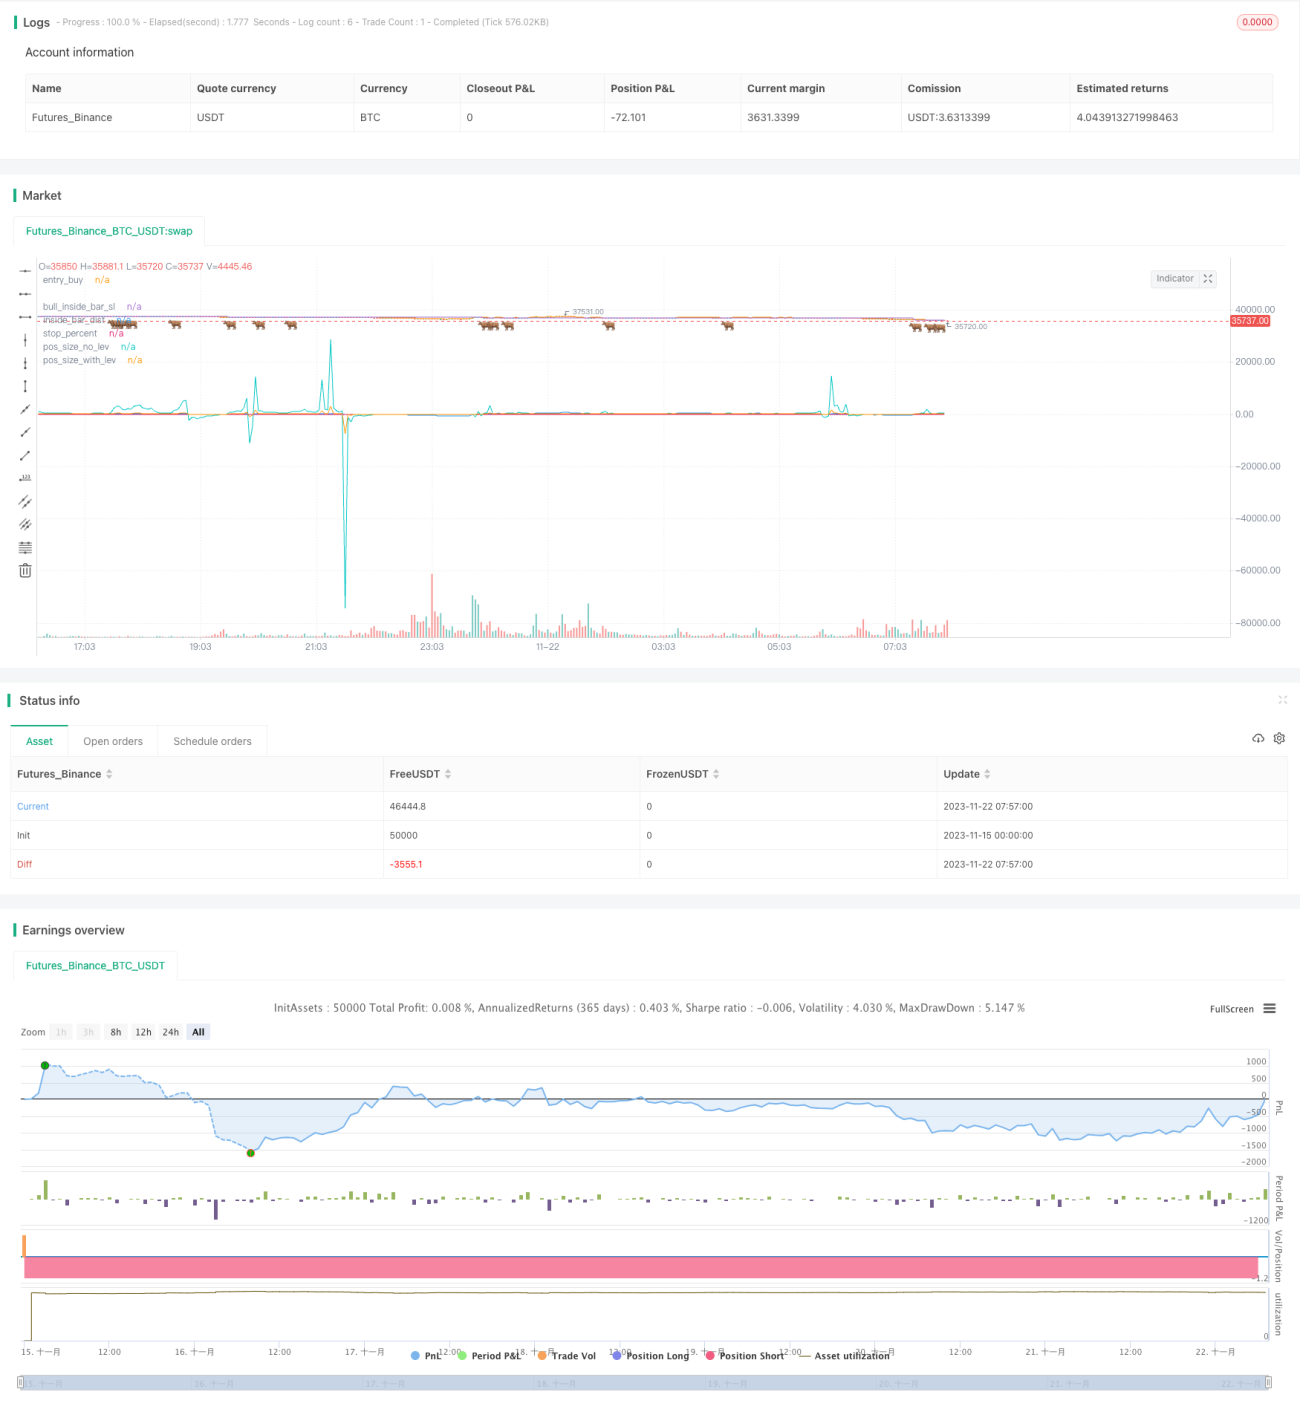
/*backtest
start: 2023-11-15 00:00:00
end: 2023-11-22 08:00:00
period: 3m
basePeriod: 1m
exchanges: [{"eid":"Futures_Binance","currency":"BTC_USDT"}]
*/

// LOVE JOY PEACE PATIENCE KINDNESS GOODNESS FAITHFULNESS GENTLENESS SELF-CONTROL
// This source code is subject to the terms of the Mozilla Public License 2.0 at https://mozilla.org/MPL/2.0/
// © JoshuaMcGowan
// I needed to test/verify the functionality for canceling an open limit order in a strategy and also work thru the pieces needed to set the position sizing so each loss is a set amount. - 1