ボリンジャーバンドに基づく短期トレンド追跡戦略

概要
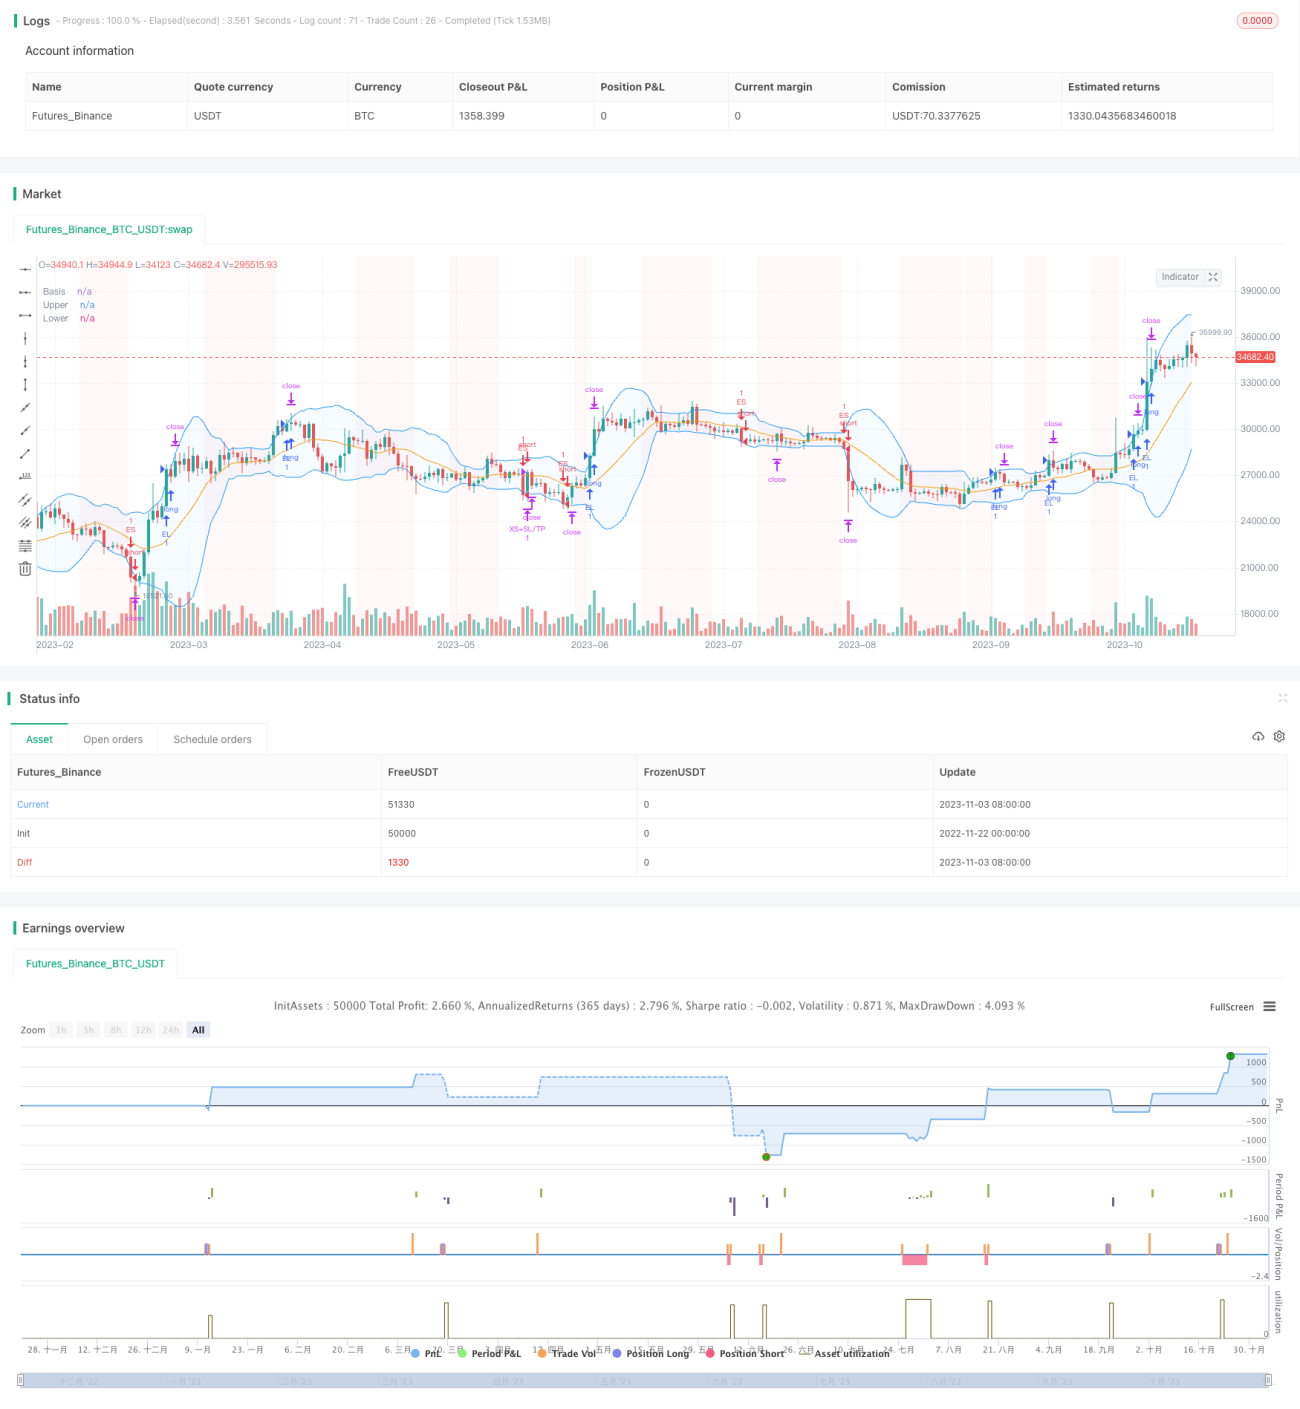
ブリン帯突破戦略は,ブリン帯指標に基づく短期トレンド追跡型の戦略である.多頭と空頭の両方方向の操作を実行することができ,現貨と永続契約に適用され,特にトレンド行情に適用される.
この戦略は高度に構成可能で,ブリン帯のパラメータ期間と偏差,トレンドフィルター,波動フィルター,取引方向フィルター,変動率フィルター,日付フィルターなどをユーザに設定できます. さらに,多頭と空頭ポジションにストップ・ロスを設定し,ストップ・ストップとストップ・ロスを追跡し,総合的なリスク管理方法を確保します.
戦略原則
この戦略の核心指標はブリン帯である.ブリン帯は,価格の平均線,波動の上限,波動の下限を表す3つの線で構成され,価格が上線を突破すると,多めに;価格が下線を突破すると,空っぽにする.
また,Noise取引を避けるための補助フィルターも用意されている.
-
トレンドフィルター: 価格が移動平均線上には多し,移動平均線下には空し.
-
波動性のフィルター:波動性が拡大したときにのみ取引する.
-
取引方向のフィルター:標識の属性に応じて,多額取引,空白取引,双方向取引を選択する.
-
変動率フィルター:価格が前取引日の閉盘価格に対する変動率が一定のレベルに達したときにのみ入力される.
-
日付フィルター: 測り戻す時間帯の設定.
すべてのフィルター条件が満たされたときに取引シグナルが生成されます. 停止,止損および追跡止損は,リスク管理を保証します. さらに,最大日内損失設定は,1日間の大幅な撤回を回避します.
優位分析
この戦略の利点は以下の通りです.
-
この成熟した指数であるブリン・バンドは,信頼性の高い取引信号として使用されています.
-
複数のフィルタが設計されていて,誤った取引を防ぎ,配置が可能です.
-
停止・停止・追跡・停止は包括的で柔軟性があります
-
最大1日間の損失を設定し,1日間の撤収を有効に制御する.
-
市場が動いているからこそ 収益の有望さがあるのです
リスク分析
この戦略にはリスクもあります.
-
ブリン帯突破は,頭部や下部に偽突破が起こり,損害を招く可能性があります.
-
市場を整理する際には,過濾器が過度に厳格になり,取引の機会を逃してしまう可能性があります.
-
大幅な空飛ぶことは,直接的に止境線を突破して損害を招く可能性があります.
-
極端な状況では,巨額の損失を完全に避けることはできません.
上記のリスクに対応して,フィルタリング条件を適切に緩和したり,人工介入により部分ポジションを閉鎖したり,止損距離を低減したりすることができる.
最適化の方向
この戦略は,以下の点で最適化できる:
-
異なるパラメータの組み合わせを試し,最適なパラメータの区間を探します.
-
機械学習モデルを追加し,パラメータの動的最適化を実現します.
-
タイムストップ,振幅ストップなどのより効果的なストップ方法を研究する.
-
感情の指標を組み合わせて,極端な状況に積極的に介入する.
-
関連製品と組み合わせて統計的アベरेजを行う.
要約する
ブリン帯突破戦略は,成熟した信頼性の高いショートラインのトレンドフォロー戦略である. ブリン帯の指標を信号として採用し,信号の信頼性を確保する複数のフィルターを設定している. 同時に,全面的な止損とリスク管理の仕組みがリスクを制御している. この戦略は,活発なトレンドマーケットに適しており,良い収益の可能性がある. 継続的な最適化により,強力な量化取引システムになる見通しがある.
- 1