月次終値と移動平均のクロスオーバー戦略

1
Follow
1779
Followers
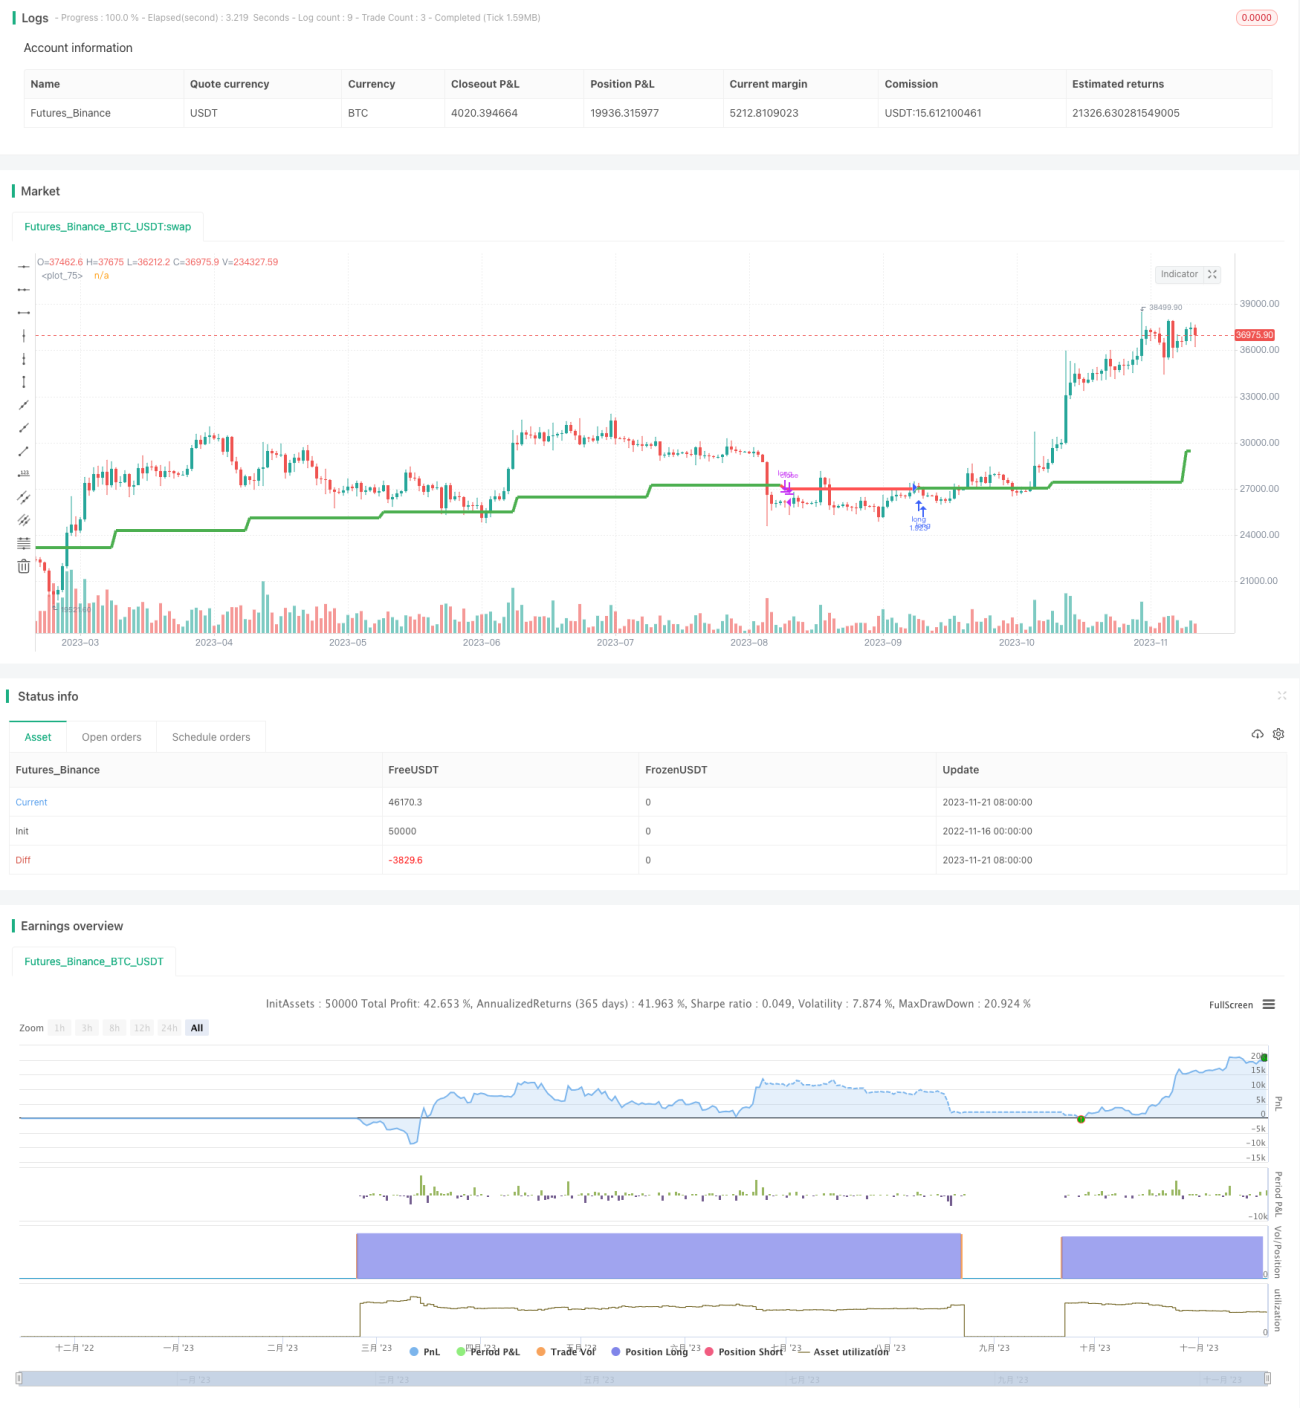
概要
この戦略は,月線の閉じる価格と移動平均線の交差を活用して取引信号を生成する.月線の閉じる価格の上部で移動平均線を横切るときは,多めに;月線の閉じる価格の下部で移動平均線を横切るときは,平仓する.
戦略原則
この戦略の核心的な論理は:
- 移動平均線の周期パラメータを入力し,SMAまたはEMAを選択できます.
- 移動平均線が表示されます.
- 他の株の閉店価格をシグナルとして選択できます.
- 月線閉盤価格と移動平均線の関係による取引シグナル判断
- 移動平均線を閉店価格に並べて,多額の投資を行います.
- 移動平均線を横切って,平仓
この戦略は,移動平均線の平滑な特性を利用し,価格の部分的なノイズをフィルターして,株価の中期トレンドの転換を捕捉する.株価が平均線を越えたとき,株価が牛市トレンドを形成していることを示す;株価が平均線を越えたとき,株価トレンドが熊市に転換していることを示す.
戦略的優位性
この戦略の主な利点は以下の通りです.
- 月経データを活用して,夜間の騒音をフィルターし,株価の中長期トレンドを捉える
- 移動平均線周期をカスタマイズし,パラメータを異なる株式に最適化
- 安定性を高めるため,別の株を信号源として選択できます.
- アドバンストな反塗装技術により,復旧を防止します.
- 任意の反測時間周期を入力して,テストを最適化できます.
全体として,この戦略の枠組みはシンプルで実用的で,パラメータ最適化によってほとんどの株式に適用でき,特に中長期投資家に適しています.
戦略リスク
この戦略にはいくつかのリスクがあり,以下のような部分に重点を置いています.
- 月次データ更新が遅いため,価格の変化をリアルタイムで反映できない.
- 遅滞があり,ショートラインの取引機会が逃れることもある.
- 移動平均線は遅滞性があり,信号の発生時刻は制御できない.
- パラメータの不適切な選択は,過度に保守的または機会を逃す可能性があります
リスクの低減のために,以下の方法で最適化できます.
- より短い時間枠の技術指標を組み合わせた補助判断
- 移動平均線周期を調整して,最適なパラメータの組み合わせを見つける
- より安定した標識を信号源として利用する
- ポジションの規模を適切に調整し,単発損失を制御する
戦略最適化の方向性
この戦略は,以下のようないくつかの点で最適化できる大きな余地があります.
- 利潤を固定し,リスクをコントロールするストップ・ロスの策略を増やす
- KD,MACDなどの他の指標と組み合わせて,取引信号の正確性を向上させる
- 機械学習技術による移動平均線参数動的最適化
- ポジション管理モジュールを追加し,トレンドに合わせてポジションのallocatorsizeを変更します.
- 多空変換機能が追加され,市場の状況に応じて柔軟に調整できます.
- 低時間枠のK線に joiningして,より機敏な取引を実現
要約する
月線終盤価格と移動均線交差策の全体的な構想は明確で,容易に実現し,パラメータ調整により,異なる株式に適用され,特に中長期線投資家に適しています. 止損,最適化パラメータなどのモジュールの継続的な強化とともに,この戦略はより優れたパフォーマンスを期待できます.
Source
Pine
Strategy parameters
Related strategies
Comment
All comments (0)
No data
- 1