移動平均と相対力指数戦略


作成日: 2023-11-28 14:07:46 最終変更日: 2023-11-28 14:07:46
コピー: 0 クリック数: 659
1
フォロー
1617
フォロワー

移動平均と相対力指数戦略

概要

移動平均と相対的に弱い指標戦略 (Moving Average Relative Strength Index Strategy) は,移動平均と相対的に強い指標を同時に取引信号として利用する量化取引戦略である.この戦略は,価格の移動平均と相対的に強い指標の数値を比較して取引信号を生成し,市場動向の機会を捕捉する.

戦略原則

この戦略は主に2つの指標に基づいています.

  1. 単純移動平均 ((SMA):価格の平均的な傾向を反映する.
  2. 比較的強い指標 ((RSI): 価格の強い弱さを反映する.

この戦略の核心的な論理は:

RSI指標ラインが移動平均線より低いときは,超売り区域であり,株価が過小評価され,買取シグナルが生じます.RSI指標ラインが移動平均線より高いときは,超買い区域であり,株価が過小評価され,売出シグナルが生じます.

つまり,移動平均は,ある程度,株式の公正価値を反映し,RSIは,株式の現在の強弱な状態を表しています.RSIは,移動平均より高くまたは低く,逆転の機会があることを意味します.

具体的には,この戦略は以下のステップで取引シグナルを生成します.

  1. 株のRSI値と 単純移動平均を計算する
  2. RSI指標値と移動平均の大きさの関係
  3. RSIが移動平均を突破すると,売り込み信号が生じる
  4. RSIが移動平均を下回ると,買い信号が作られる
  5. ストップポイントを設定し,ストップを移動してリスクをコントロールする

戦略的優位性

この戦略は,移動平均のトレンド判断と,RSI指標の超買い超売り判断を組み合わせて,異なる指標の優位性を総合的に利用し,市場の転換点を効果的に判断することができます.

主要な優位性は以下の通りです.

  1. 移動平均は価格の動向を効果的に指示します.
  2. RSIは過剰買いと過剰売りを反映する
  3. 市場転換点を判断する2つの指標の組み合わせにより高い精度
  4. リスクのコントロールに ストップポイントを設定できます

戦略リスク

この戦略にはいくつかのリスクがあります.

  1. 指標が誤った信号を出す可能性があり,不必要な損失を招く可能性があります
  2. ストップダウンは,状況が激しく揺れ動くと,破られ,大きな損失を招く可能性があります.
  3. パラメータの設定が不適切である場合も, 方針のパフォーマンスに影響します.

リスクの管理のために,以下の方法で最適化できます.

  1. 移動平均とRSIのパラメータを調整し,指標の信号をより信頼できるようにします.
  2. 停止点を適切に緩め,停止が頻繁に発生しないようにする.
  3. DYNAMIC ストップなどの移動式ストップを使用し,ストップをより柔軟にします.

戦略最適化の方向性

この戦略は,次の方向にも改善できます.

  1. 異なる周期のパラメータの組み合わせをテストし,最適なパラメータを探します.
  2. 交差量指標などの他の指標のフィルタを追加して,信号の信頼性を向上させる
  3. ストップ・ロスの戦略を最適化し,ストップ・ロスをよりダイナミックで合理的にします.
  4. ディープラーニングなどの技術と組み合わせた自己適応パラメータ最適化メカニズム
  5. ポジション管理モジュールを追加し,市場状況に応じてポジションを動的に調整する

パラメータ最適化,指標最適化,リスク管理最適化などの方法で,この戦略の安定性と収益性を向上させることができます.

要約する

移動平均と相対的に強い指標戦略は,価格傾向判断と超買い超売り判断を同時に利用することで,市場の転換点を効果的に判断し,逆転の機会を掴むことができます. この戦略は,シンプルで実用的で,リスクが制御可能であり,実用的な量化取引戦略です. 継続的な最適化により,より優れた効果を得ることができます.
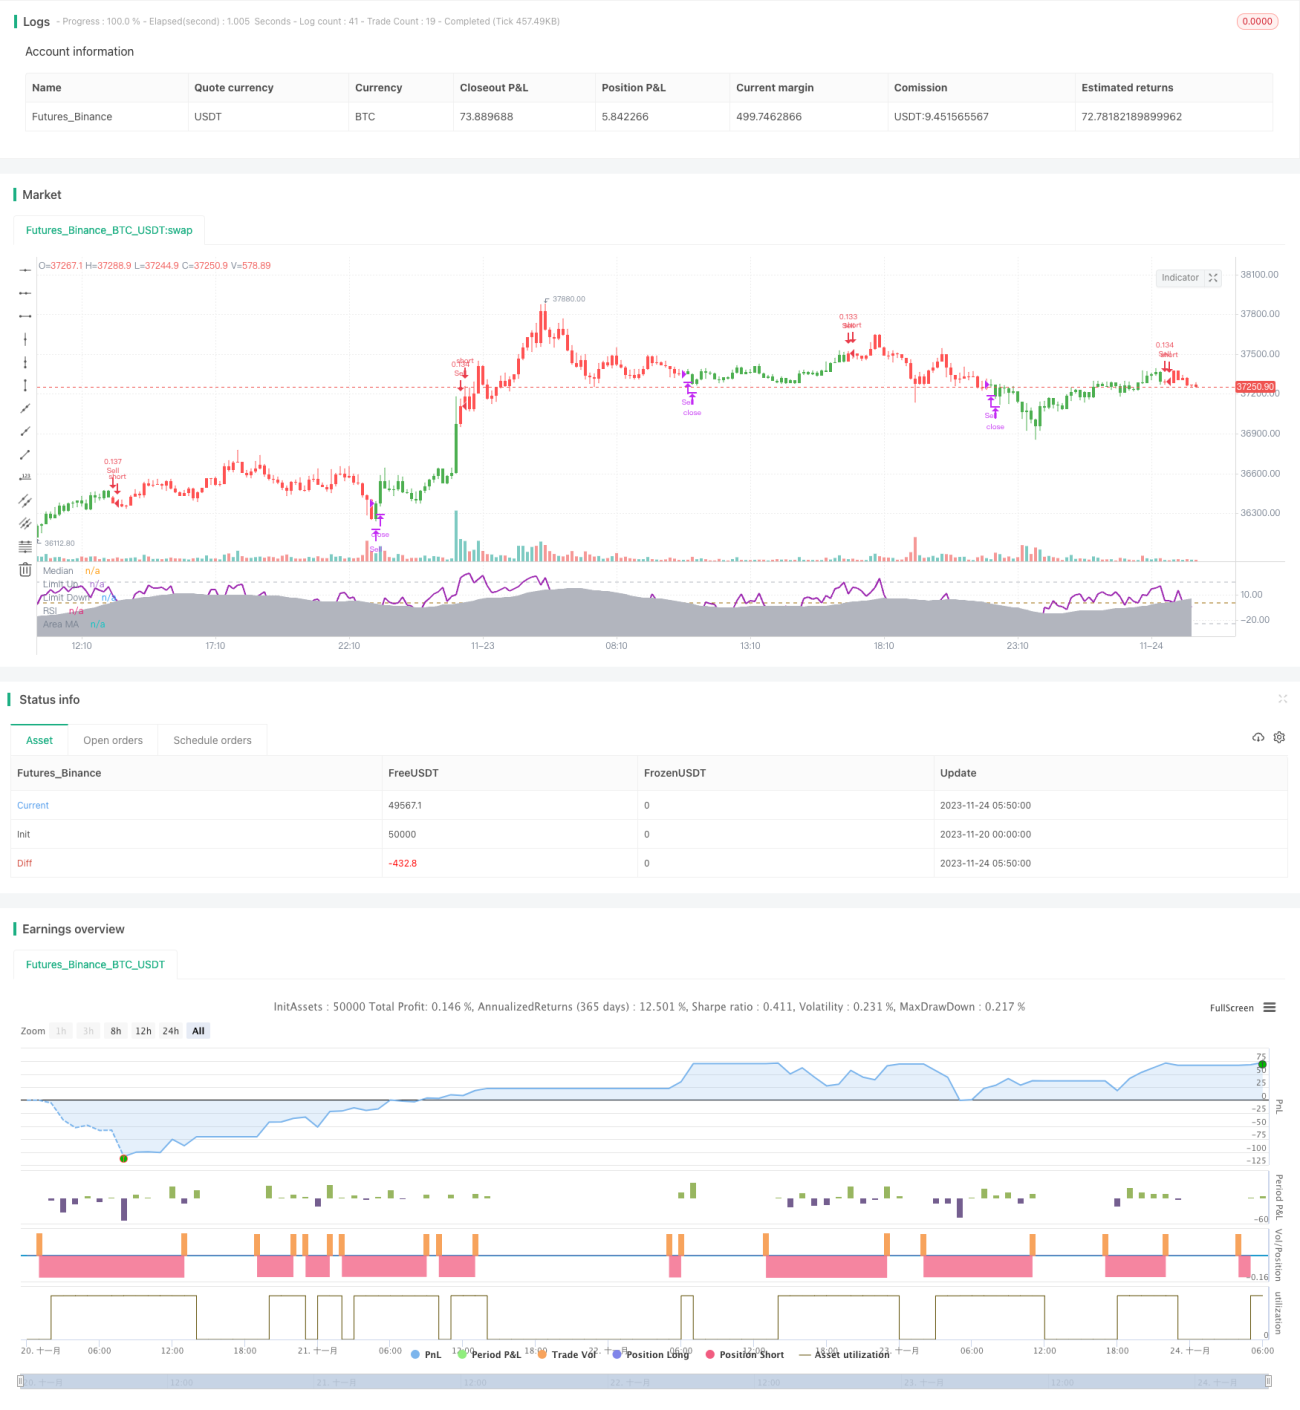
ストラテジーソースコード
/*backtest
start: 2023-11-20 00:00:00
end: 2023-11-24 06:00:00
period: 10m
basePeriod: 1m
exchanges: [{"eid":"Futures_Binance","currency":"BTC_USDT"}]
*/

//@version=2

strategy(title = "RSI versus SMA", shorttitle = "RSI vs SMA", overlay = false, pyramiding = 0, default_qty_type = strategy.percent_of_equity, default_qty_value = 10, currency = currency.GBP)

// Revision:        1
// Author:          @JayRogers
//
// *** USE AT YOUR OWN RISK ***
// - Nothing is perfect, and all decisions by you are on your own head. And stuff.
//
// Description:
//  - It's RSI versus a Simple Moving Average.. Not sure it really needs much more description.
//  - Should not repaint - Automatically offsets by 1 bar if anything other than "open" selected as RSI source.

// === INPUTS ===
// rsi
rsiSource   = input(defval = open, title = "RSI Source")
rsiLength   = input(defval = 8, title = "RSI Length", minval = 1)
// sma
maLength    = input(defval = 34, title = "MA Period", minval = 1)
// invert trade direction
tradeInvert = input(defval = false, title = "Invert Trade Direction?")
// risk management
useStop     = input(defval = false, title = "Use Initial Stop Loss?")
slPoints    = input(defval = 25, title = "Initial Stop Loss Points", minval = 1)
useTS       = input(defval = true, title = "Use Trailing Stop?")
tslPoints   = input(defval = 120, title = "Trail Points", minval = 1)
useTSO      = input(defval = false, title = "Use Offset For Trailing Stop?")
tslOffset   = input(defval = 20, title = "Trail Offset Points", minval = 1)
// === /INPUTS ===

// === BASE FUNCTIONS ===
// delay for direction change actions
switchDelay(exp, len) =>
    average = len >= 2 ? sum(exp, len) / len : exp[1]
    up      = exp > average
    down    = exp < average
    state   = up ? true : down ? false : up[1]
// === /BASE FUNCTIONS ===

// === SERIES and VAR ===
// rsi
shunt = rsiSource == open ? 0 : 1
rsiUp = rma(max(change(rsiSource[shunt]), 0), rsiLength)
rsiDown = rma(-min(change(rsiSource[shunt]), 0), rsiLength)
rsi = (rsiDown == 0 ? 100 : rsiUp == 0 ? 0 : 100 - (100 / (1 + rsiUp / rsiDown))) - 50 // shifted 50 points to make 0 median
// sma of rsi
rsiMa   = sma(rsi, maLength)
// self explanatory..
tradeDirection = tradeInvert ? 0 <= rsiMa ? true : false : 0 >= rsiMa ? true : false
// === /SERIES ===

// === PLOTTING ===
barcolor(color = tradeDirection ? green : red, title = "Bar Colours")
// hlines
medianLine  = hline(0, title = 'Median', color = #996600,  linewidth = 1)
limitUp     = hline(25, title = 'Limit Up', color = silver,  linewidth = 1)
limitDown   = hline(-25, title = 'Limit Down', color = silver,  linewidth = 1)
// rsi and ma
rsiLine     = plot(rsi, title = 'RSI', color = purple, linewidth = 2, style = line, transp = 50)
areaLine    = plot(rsiMa, title = 'Area MA', color = silver, linewidth = 1, style = area, transp = 70)
// === /PLOTTING ===

goLong() => not tradeDirection[1] and tradeDirection
killLong() => tradeDirection[1] and not tradeDirection
strategy.entry(id = "Buy", long = true, when = goLong())
strategy.close(id = "Buy", when = killLong())

goShort() => tradeDirection[1] and not tradeDirection
killShort() => not tradeDirection[1] and tradeDirection
strategy.entry(id = "Sell", long = false, when = goShort())
strategy.close(id = "Sell", when = killShort())

if (useStop)
    strategy.exit("XSL", from_entry = "Buy", loss = slPoints)
    strategy.exit("XSS", from_entry = "Sell", loss = slPoints)
// if we're using the trailing stop
if (useTS and useTSO) // with offset
    strategy.exit("XSL", from_entry = "Buy", trail_points = tslPoints, trail_offset = tslOffset)
    strategy.exit("XSS", from_entry = "Sell", trail_points = tslPoints, trail_offset = tslOffset)
if (useTS and not useTSO) // without offset
    strategy.exit("XSL", from_entry = "Buy", trail_points = tslPoints)
    strategy.exit("XSS", from_entry = "Sell", trail_points = tslPoints)