Noro の高速 RSI スイッチング戦略 v1.7
概要
Noroの急速RSIスイッチ戦略は,RSI指標を利用して超買超売の機会を識別する量化取引戦略である.この戦略は,K線形,均線フィルタリングとストップ・ロスの方法を組み合わせて,リスクを制御する.
この戦略は以下の主要な要素に基づいています.
- 超買いと超売りを識別する RSI指標
- K線形:K線実体と陰陽線を組み合わせ,傾向を補助判断
- 均線フィルタリング:SMA均線を使ってフィルタリングし,偽信号を避ける
- 止損メカニズム:RSIの極限領域を組み合わせて止損を実現する
戦略原則
Noroの急速RSIスイッチは,主に以下の種類の買い/売却のシグナルを判断します.
急速RSI超買超売シグナル:急速RSIが上限を突破したり下限を突破したりすると,取引シグナルが生成される.
K線形信号:K線実体サイズ,陽陽線方向などと組み合わせて,トレンドを判断し,急速なRSI生成信号を補助する.
均線フィルター信号:SMA均線方向を組み合わせて,偽突破を避ける.
ストップシグナル: 急速なRSIが上限または下限を突破すると,平仓ストップ.
具体的には,この戦略は,急速RSIの超買い超売り区間に基づいて取引機会を判断する. 急速RSIの下の限界を突破すると,超売り信号とみなされ,急速RSI上の限界を突破すると,超買い信号とみなされる.
騒音を避けるために,以下のような補助的な判断が加えられています.
- K線実体サイズ:K線実体が大きければ大きいほど,傾向が顕著になる
- 陰陽線:K線の方向を判断する
- SMA平均線:偽突破信号をフィルターする
- ストップ:RSIが制限区域を回転する際のストップ
この戦略は,迅速なRSI,K線形状,均線,ストップを組み合わせて取引決定を行う.
戦略的優位性
この戦略の利点は以下の通りです.
- RSIは,超買いや超売りの機会を迅速に捉えることができます.
- K線と均等線の補助判断:騒音取引を避ける
- 自動ストップ: 早期にストップし,リスクを制御する
- ショートライン取引: 1時間,30分などのショートライン周期に適用
- 楽観化: 異なる市場に対応してパラメータを調整できる
戦略リスク
この戦略にはいくつかのリスクがあります.
- 連続停止が起こりうる:震動の状況では,より多くの停止信号が発生する
- パラメータの最適化:周期や品種によってパラメータの調整が必要
- 損失を完全に回避することは不可能です. 損失を一時停止することは,一定程度の損失をもたらします.
リスクを下げるには,以下の方法で最適化できます.
- RSIを最適化して,取引の騒音を減らす.
- ストップ・ポジションを最適化して,単一損失を制御する
- 資金管理モジュールを追加し,リスクを分散する
戦略最適化の方向性
この戦略は以下の点で最適化できます.
- 増額ストップ戦略: 利益が一定レベルに達した後にストップし,利益の一部をロックする
- 資金管理の強化:ポジション管理,リスク分散などの管理手段の追加
- 異なる周期パラメータの最適化:指標パラメータを調整し,異なる周期の効果をテストする
- 機械学習の増強:アルゴリズムを使ってパラメータを自動で最適化し,市場の変化に適応する
- 種別テスト: 戦略の強さをより多くの種でテストする
ストップ,リスクマネジメント,パラメータ最適化,機械学習などの手段によって,この戦略をさらに完善することで,戦略の安定性を大幅に向上させることができる.
要約する
全体として,Noroの急速RSIスイッチング戦略は,急速RSI指標と補助K線技術指標を組み合わせて,超買い超売りを判断するショートライン取引戦略を実現している. この戦略は,迅速に反応し,容易に最適化でき,同時に,リスクを制御するストップ・ロスのモジュールが加えられている. 機械学習とパラメータのさらなる最適化により,より良い戦略効果が得られる見込みがある.
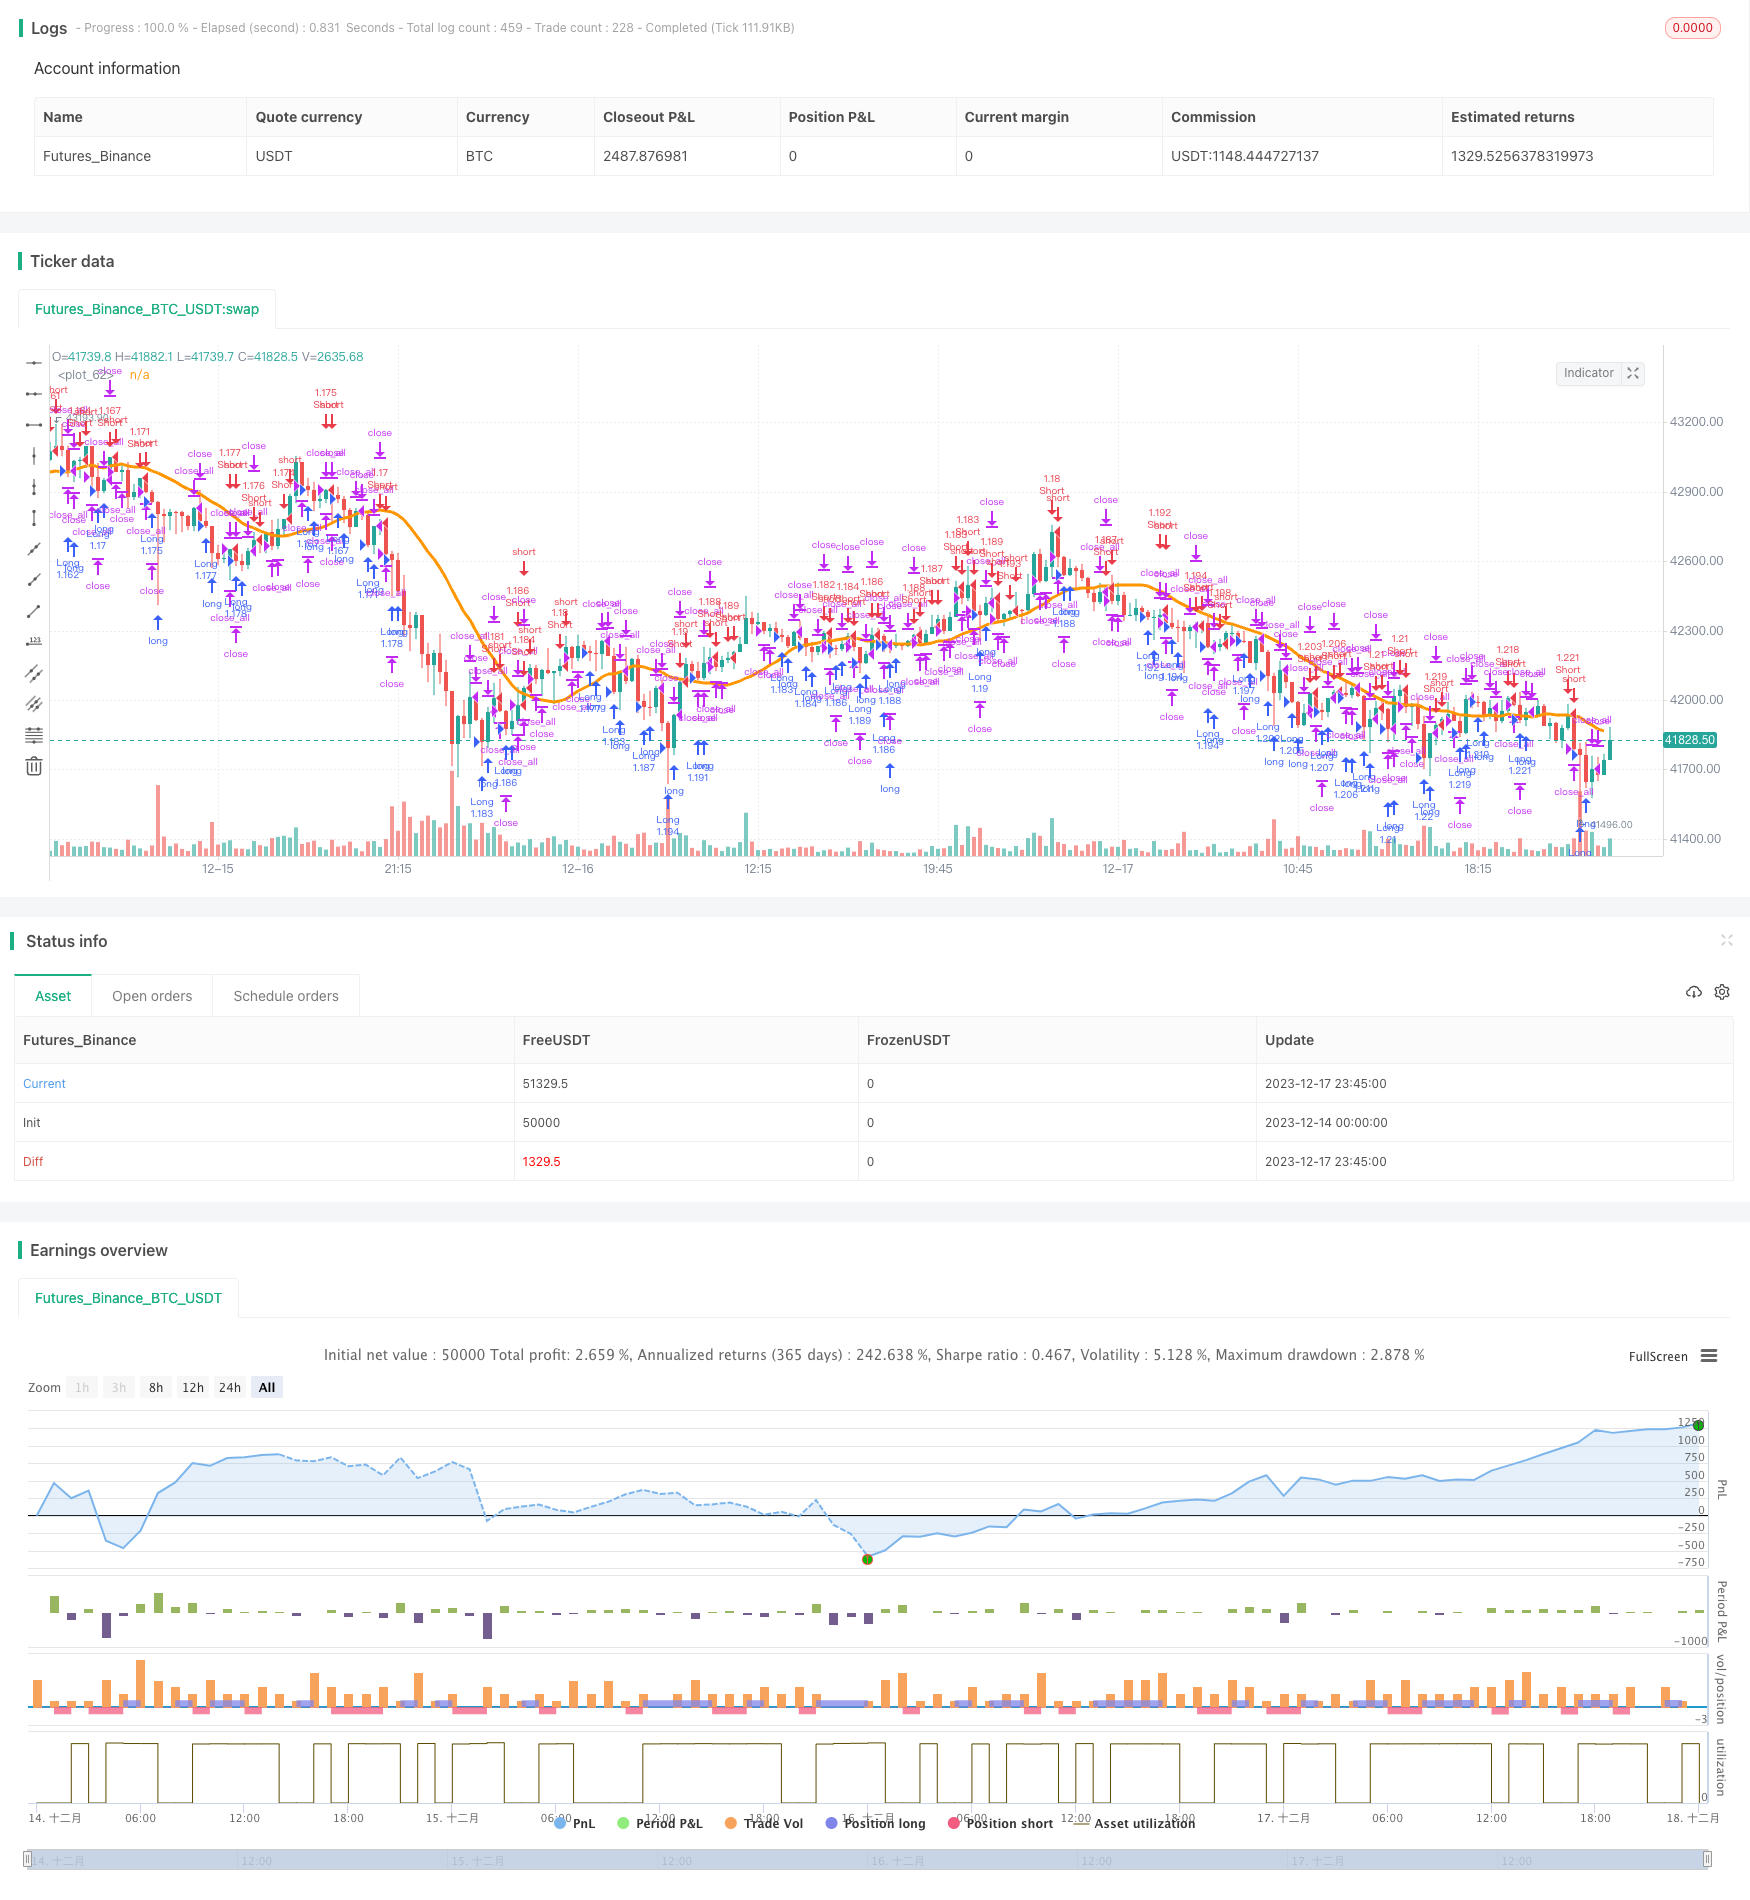
/*backtest
start: 2023-12-14 00:00:00
end: 2023-12-18 00:00:00
period: 15m
basePeriod: 5m
exchanges: [{"eid":"Futures_Binance","currency":"BTC_USDT"}]
*/

//Noro
//2018

//@version=2
strategy(title = "Noro's Fast RSI Strategy v1.7", shorttitle = "Fast RSI str 1.7", overlay = true)

//Settings
needlong = input(true, defval = true, title = "Long")
needshort = input(true, defval = true, title = "Short")
usemar = input(false, defval = false, title = "Use Martingale")
capital = input(100, defval = 100, minval = 1, maxval = 10000, title = "Capital, %")
usersi = input(true, defval = true, title = "Use Fast RSI Strategy")
usemm = input(true, defval = true, title = "Use Min/Max Strategy")
usebc = input(true, defval = true, title = "Use BarColor Strategy")
usesma = input(false, defval = false, title = "Use SMA Filter")
smaperiod = input(20, defval = 20, minval = 2, maxval = 1000, title = "SMA Filter Period")
fast = input(7, defval = 7, minval = 2, maxval = 50, title = "Fast RSI Period")
limit = input(30, defval = 30, minval = 1, maxval = 100, title = "RSI limit")
rsisrc = input(close, defval = close, title = "RSI Price")
rsibars = input(1, defval = 1, minval = 1, maxval = 20, title = "RSI Bars")
mmbars = input(1, defval = 1, minval = 1, maxval = 5, title = "Min/Max Bars")
showsma = input(false, defval = false, title = "Show SMA Filter")
showarr = input(false, defval = false, title = "Show Arrows")
fromyear = input(2018, defval = 2018, minval = 1900, maxval = 2100, title = "From Year")
toyear = input(2100, defval = 2100, minval = 1900, maxval = 2100, title = "To Year")
frommonth = input(01, defval = 01, minval = 01, maxval = 12, title = "From Month")
tomonth = input(12, defval = 12, minval = 01, maxval = 12, title = "To Month")
fromday = input(01, defval = 01, minval = 01, maxval = 31, title = "From day")
today = input(31, defval = 31, minval = 01, maxval = 31, title = "To day")

//Fast RSI
fastup = rma(max(change(rsisrc), 0), fast)
fastdown = rma(-min(change(rsisrc), 0), fast)
fastrsi = fastdown == 0 ? 100 : fastup == 0 ? 0 : 100 - (100 / (1 + fastup / fastdown))

//Limits
bar = close > open ? 1 : close < open ? -1 : 0
uplimit = 100 - limit
dnlimit = limit

//RSI Bars
upsignal = fastrsi > uplimit ? 1 : 0
dnsignal = fastrsi < dnlimit ? 1 : 0
uprsi = sma(upsignal, rsibars) == 1
dnrsi = sma(dnsignal, rsibars) == 1

//Body
body = abs(close - open)
abody = sma(body, 10)

//MinMax Bars
min = min(close, open)
max = max(close, open)
minsignal = min < min[1] and bar == -1 and bar[1] == -1 ? 1 : 0
maxsignal = max > max[1] and bar == 1 and bar[1] == 1 ? 1 : 0
mins = sma(minsignal, mmbars) == 1
maxs = sma(maxsignal, mmbars) == 1

//SMA Filter
sma = sma(close, smaperiod)
colorsma = showsma ? blue : na
plot(sma, color = colorsma, linewidth = 3)

//Signals
up1 = bar == -1 and (strategy.position_size == 0 or close < strategy.position_avg_price) and dnrsi and body > abody / 5 and usersi
dn1 = bar == 1 and (strategy.position_size == 0 or close > strategy.position_avg_price) and uprsi and body > abody / 5 and usersi
up2 = mins and (close > sma or usesma == false) and fastrsi < 70 and usemm
dn2 = maxs and (close < sma or usesma == false) and fastrsi > 30 and usemm
up3 = sma(bar, 2) == -1 and usebc
dn3 = sma(bar, 2) == 1 and usebc
exit = (((strategy.position_size > 0 and fastrsi > dnlimit and bar == 1) or (strategy.position_size < 0 and fastrsi < uplimit and bar == -1)) and body > abody / 2)

//Arrows
col = exit ? black : up1 or dn1 ? blue : up2 or dn2 ? red : na
needup = up1 or up2
needdn = dn1 or dn2
needexitup = exit and strategy.position_size < 0
needexitdn = exit and strategy.position_size > 0
plotarrow(showarr and needup ? 1 : na, colorup = blue, colordown = blue, transp = 0)
plotarrow(showarr and needdn ? -1 : na, colorup = blue, colordown = blue, transp = 0)
plotarrow(showarr and needexitup ? 1 : na, colorup = black, colordown = black, transp = 0)
plotarrow(showarr and needexitdn ? -1 : na, colorup = black, colordown = black, transp = 0)

//Trading
profit = exit ? ((strategy.position_size > 0 and close > strategy.position_avg_price) or (strategy.position_size < 0 and close < strategy.position_avg_price)) ? 1 : -1 : profit[1]
mult = usemar ? exit ? profit == -1 ? mult[1] * 2 : 1 : mult[1] : 1
lot = strategy.position_size == 0 ? strategy.equity / close * capital / 100 * mult : lot[1]

if up1 or up2 or up3
    if strategy.position_size < 0
        strategy.close_all()

    strategy.entry("Long", strategy.long, needlong == false ? 0 : lot)

if dn1 or dn2 or dn3
    if strategy.position_size > 0
        strategy.close_all()

    strategy.entry("Short", strategy.short, needshort == false ? 0 : lot)

if time > timestamp(toyear, tomonth, today, 23, 59) or exit
    strategy.close_all()