TrendSurfing - ダブル移動平均クロスオーバートレンド戦略
概要
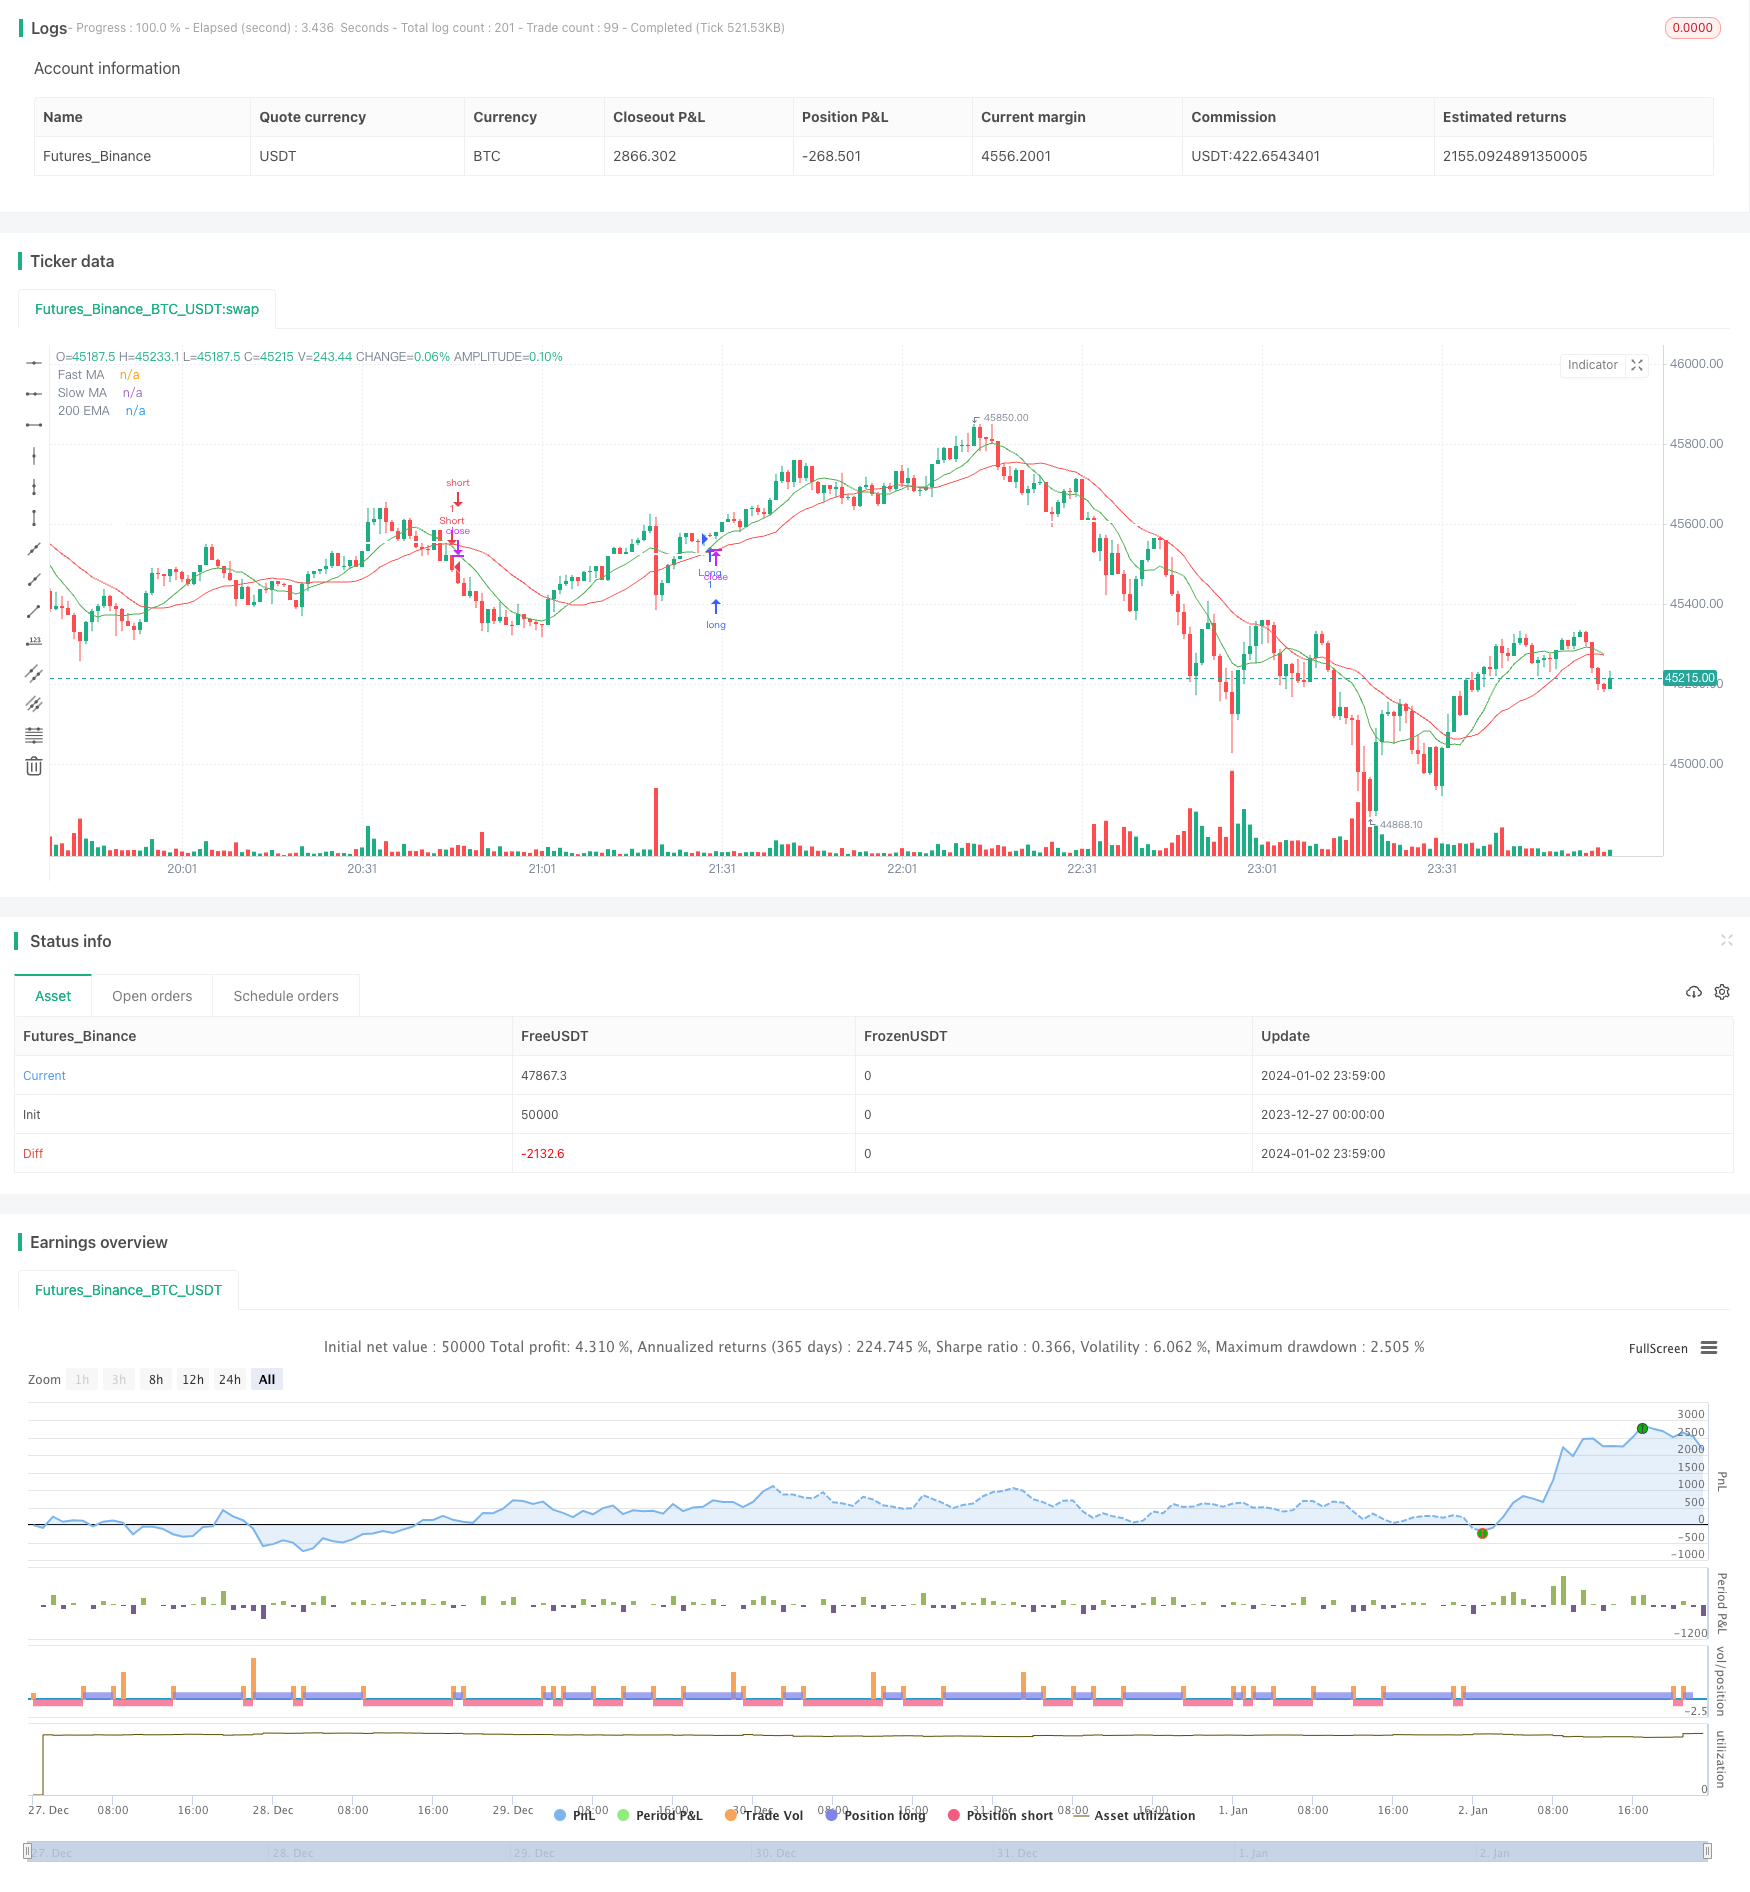
トレンドサーフィング戦略は,二均線交差を主要な取引信号として使用するトレンド追跡戦略である.それは同時に,三角形視覚指標,200日EMA,ROC指標およびRSI指標を組み合わせて,ノイズをフィルターし,トレンドの転換点で新しいトレンドの方向を正確に捕捉する.この戦略は,中長線のポジションに適しており,牛市で安定した成長を得ることができます.
戦略原則
トレンドサーフィン戦略は,主に,高速移動平均と遅い移動平均の金叉死叉をベースに,買入と売却の信号を形成する. 速い移動平均の上に遅い移動平均を横切るときに買入の信号が生じる. 速い移動平均の下に遅い移動平均を横切るときに売出の信号が生じる.
さらに,偽信号をフィルターしたり,トレンドの質を決定するために,複数の補助指標を導入しています.具体的には:
- ROC指標は価格の変化の傾向と速度を判断する.
- RSIが超買超売の領域にあるか判断
- 200日EMAは,全体的なトレンドの方向を判断する
- グラフ上の入場点をマークする三角形視覚指標
複数の指標を総合的に判断することで,トレンドサーフィン戦略はトレンドの転換点を正確に特定し,長線を明らかにし,市場騒音やショートラインの調整によって誤導されないようにします.
優位分析
1. 明確なトレンドを捉える
この戦略は平均線交差の基本判断でトレンドの転換点を判断し,200日EMAなどの指標を組み合わせて,ショートラインのノイズをフィルターし,中中長線のトレンドの把握に焦点を当てている.
2. 複数の指標の組み合わせにより,高品質の入場を 確認するタイミング
均線交差自体に加えて,この戦略はROC,RSIなどの指標を導入し,トレンドの転換点での震動区間を回避し,入場品質を確保する.
3. 直感的に読みやすい三角形視覚指標
緑の下向きの三角形は買い時,赤の上向きの三角形は売り時です.
4. 異なるニーズに対応するカスタマイズ可能なパラメータ
平均線パラメータ,ROC長さ,RSI長さなど,自分の取引スタイルに合わせて自由に調整できます.
5. ストップ・ストップ・マネジメント この戦略は,ATRの値をリスクの比率で止損位とストップポジットとして使用し,単一取引のリスクを制御する.
リスク分析
1. 欠落するリスク
均線交差に基づく戦略は,均線振動で発生する特定の漏えいまたは止損のリスクに直面する.
2. パラメータを正しく設定しないことにより,過度に最適化される
ユーザは,標準パラメータを追求することを避け,指標数値を過度に理想的に設定する.異なる市場情勢と品種に応じてパラメータテストを行うべきである.
3. 市場におけるシステム上のリスクの全般的なフィルタリングができない ブラック・スウェン事件のような極端な状況では,大きな損失を招く可能性があります.
最適化の方向
1. テストと最適化パラメータの設定
平均線周期,ROC長さ,RSIパラメータなどに,異なる取引品種の特性をより適合させるため,リターンと最適化を行う必要があります.
2. 他の補助指標をテストし導入する
BOLL,KDJなどの他の指標と平均線交差の組み合わせ効果をテストすることもできます.
3. ストップ・ストップ・ロスの最適化とアルゴリズム取引
機械学習アルゴリズムを導入し,ストップ・ストップをスマートに,変化する市場環境に適応させる.
4. 他の戦略やモデルとの組み合わせを模索する
基本的株式選択戦略,統計的アバरेज戦略,ポートフォリオ最適化モデルなどと組み合わせることで,リスクをさらに制御し,収益率を向上させることができる.
要約する
トレンドサーフィン戦略は,シンプルで直接的な,リスクが制御可能なトレンド追跡戦略である.これは,双均線交差形成の取引信号を中心に展開され,複数の補助指標でフィルターされます.この戦略は,中長期ラインのポジションに適用され,牛市トレンドを安定的に追跡できます.我々は,パラメータテスト,指標拡張,リスク制御などの手段によって,この戦略を最適化し続け,より広範な市場でより安定したパフォーマンスを得ます.
||
Overview
The TrendSurfing strategy is a trend tracking strategy based primarily on double moving average crossover signals. It also incorporates triangle visual indicators, 200-day EMA, ROC indicator and RSI indicator to filter out noise and accurately capture trend reversals. This strategy is suitable for medium-to-long-term holding and can achieve steady growth in a bull market.
Strategy Logic
The TrendSurfing strategy mainly relies on golden cross and death cross formed by fast moving average and slow moving average to generate buy and sell signals. When the fast MA crosses above the slow MA, a buy signal is generated. When the fast MA crosses below the slow MA, a sell signal is generated.
In addition, the strategy incorporates several auxiliary indicators to filter out false signals or determine trend quality, including:
- ROC indicator to determine price trend and momentum
- RSI oscillator to detect overbought/oversold levels
- 200-day EMA to determine overall trend direction
- Triangle visual indicators to mark entry points on chart
By comprehensively judging various indicators, the TrendSurfing strategy can accurately locate trend turning points and track definite medium-to-long term trends without being misguided by market noise or short-term corrections.
Advantage Analysis
1. Catch Medium-to-Long Term Trend
The strategy basically judges trend reversal based on MA crosses, and uses indicators like 200-day EMA to filter out short-term noise, with focus on medium-to-long term trend capture.
2. Multiple Indicators Ensure High Quality Entry
On top of MA crossover itself, the incorporation of ROC, RSI and other indicators enables avoidance of consolidation zones on reversal points and ensures quality entry.
3. Intuitive Triangle Visual Indicators
Green downward triangles indicate long entries, red upward triangles indicate short entries. Clean and straightforward.
4. Customizable Parameters for Different Needs
Users can freely adjust parameters like MA periods, ROC length, RSI length etc according to their own trading style.
5. Stop Loss and Take Profit Control
The strategy sets stop loss and take profit based on ATR value multiplied by risk percentage, enabling per trade risk control.
Risk Analysis
1. Risk of Missing Trades
Any MA crossover based strategy has inherent risk of missing trades or being stopped out when MA is oscillating.
2. Over-optimization from Improper Parameter Settings Users should avoid chasing hypothetically ideal parameter values. Parameters should be tested and adapted based on different market conditions and products.
3. Inability to Fully Filter Black Swan Events
Under extreme market conditions, strategies could still face large losses from market systemic risks.
Optimization Directions
1. Test and Optimize Parameter Values
Periods of MAs, length of ROC, values of RSI etc should go through rigorous backtesting and optimization to fit characteristics of different trading products.
2. Test and Incorporate Other Auxiliary Indicators
Continue testing combinations of other indicators like BOLL, KDJ etc with MA crosses for better performance.
3. Coordinate with Algorithmic Trading for Better Risk Control Introduce machine learning algorithms to enable more intelligent stop loss and take profit, adapting to dynamic market environments.
4. Explore Combinations with Other Strategies or Models
Combining with fundamentals-based stock picking strategies, statistical arbitrage strategies, portfolio optimization models etc could further enhance risk control and return.
Conclusion
The TrendSurfing strategy is a simple, straightforward trend tracking strategy with controllable risk. Trading signals are generated from MA crosses and filtered by multiple auxiliary indicators. It is suitable for medium-to-long term holding to steadily track bull market trends. We will continue optimizing this strategy through parameter testing, indicator expansion, risk control etc to achieve more reliable performance across diverse markets.
[/trans]
/*backtest
start: 2023-12-27 00:00:00
end: 2024-01-03 00:00:00
period: 1m
basePeriod: 1m
exchanges: [{"eid":"Futures_Binance","currency":"BTC_USDT"}]
*/

//@version=4
strategy("Moving Average Crossover with Triangles, 200 EMA, ROC, and RSI", overlay=true)

// Define input parameters
fast_length = input(9, title="Fast MA Length")
slow_length = input(21, title="Slow MA Length")
roc_length = input(14, title="ROC Length")
rsi_length = input(14, title="RSI Length")

// Calculate moving averages
fast_ma = sma(close, fast_length)
slow_ma = sma(close, slow_length)

// Plot moving averages
plot(fast_ma, color=color.green, title="Fast MA")
plot(slow_ma, color=color.red, title="Slow MA")

// Plot 200 EMA
ema_200 = ema(close, 200)
plot(ema_200, color=color.white, title="200 EMA", linewidth=2)

// Calculate Rate of Change (ROC)
roc = roc(close, roc_length)

// Calculate RSI
rsi = rsi(close, rsi_length)

// Define strategy entry and exit conditions
long_condition = crossover(fast_ma, slow_ma) and roc > 0 and close > ema_200 and rsi > 55
short_condition = crossunder(fast_ma, slow_ma) and roc < 0 and close < ema_200 and rsi < 45

// Execute strategy
strategy.entry("Long", strategy.long, when=long_condition)
strategy.entry("Short", strategy.short, when=short_condition)

// Define stop loss and take profit levels
risk_percent = input(1, title="Risk Percentage", minval=0.1, maxval=5, step=0.1) / 100
atr_value = atr(14)
stop_loss = close - atr_value * risk_percent
take_profit = close + atr_value * risk_percent

strategy.exit("Take Profit/Stop Loss", from_entry="Long", loss=stop_loss, profit=take_profit)
strategy.exit("Take Profit/Stop Loss", from_entry="Short", loss=stop_loss, profit=take_profit)

// Plot larger triangles on crossover and crossunder
plotshape(series=long_condition, title="Long Entry", color=color.green, style=shape.triangleup, location=location.belowbar, size=size.small)
plotshape(series=short_condition, title="Short Entry", color=color.red, style=shape.triangledown, location=location.abovebar, size=size.small)