ポイントストップロスとテイクプロフィットに基づくトレーリングストップロス戦略
概要
この戦略の核心思想は,EMAとWMAの交差を入場信号として利用し,ポイント数計算に基づくストップ・ローズと組み合わせて取引を行うことである.その最大の利点は,非常に柔軟で正確なリスク制御が可能であり,ポイント数サイズを調整することでストップ・ローズの幅を制御できることである.
戦略原則
EMAがWMAを上下突破すると多値シグナルが生成され,EMAがWMAを上下突破すると空値シグナルが生成されます. ポジションに入ると,入場ポイントをリアルタイムで計算し,その基礎でストップとストップを設定します. 例えば,ストップポイント20を設定し,ストップポイント100を設定すると,特定のストップポイントは入場価格を20ポイント減らします.*契約額は入札価格と100ポイントのストップ価格です.*リスクと収益をコントロールするために.
また,戦略は,現在の口コミと歴史のストップを比較し,移動ストップの位置を調整し,流動ストップの追尾価格を実現します.
優位分析
通常の固定ポイント数やパーセンテージ・ストップに比べて,この戦略の最大の利点は,非常に柔軟で正確なリスク制御である.点数の調整の大きさは,ストップ幅の大きさに直接影響を与える.これは,異なる品種に非常に適用され,市場の波動の頻度と幅に応じて微調整することができる.
また,流動ストップも非常に実用的な機能である.それは,状況のリアルタイムの変化に応じてストップポジションの調整を監視し,リスク管理を保証しながら,最大限の利益を追求することができる.
リスク分析
この戦略のリスクは,主にEMAとWMAの2つの指標自体に由来する.市場状況が急激に変化したとき,それらはしばしば誤った信号を発し,止損が容易である.この場合,適切な止損ポイントの緩和が推奨されるか,他の指標の組み合わせの代替を検討する.
もう一つのリスクポイントは,止損止めが同時に兼ね合うことが難しいことです.より高い止まりを狙うなら,通常,より大きなリスクを負う必要があります.これは,市場が転じるときに止まりやすいものです.したがって,止損止めの設定は,慎重にテストして評価する必要があります.
最適化の方向
この戦略は以下の方向から最適化できます.
- 異なるパラメータのEMAとWMAの組み合わせをテストし,最適なパラメータを見つけます.
- 勝率を向上させるには,MACD,KDJなどの他の指標を入れ替えたり組み合わせたりしてみてください.
- 異なるストップ・ストップ・ポイント数によるリスク・リターンの評価を行い,最適な配置を決定する.
- 異なる品種の特性を研究し,異なる市場に対応するパラメータを調整する.
- パラメータの動的最適化を実現する機械学習アルゴリズムに追加する.
要約する
この戦略の核心構想はシンプルで明快で,EMAとWMA指標に基づいて,点数計算に基づく止損制機構を適用してリスク管理を行う.戦略の優点は,リスク管理が精密に柔軟であり,異なる市場に適した調整が可能である.その後,入場信号,パラメータ選択,止損機構などから深度最適化が可能で,戦略を複雑な多変な市場環境により適応させる.
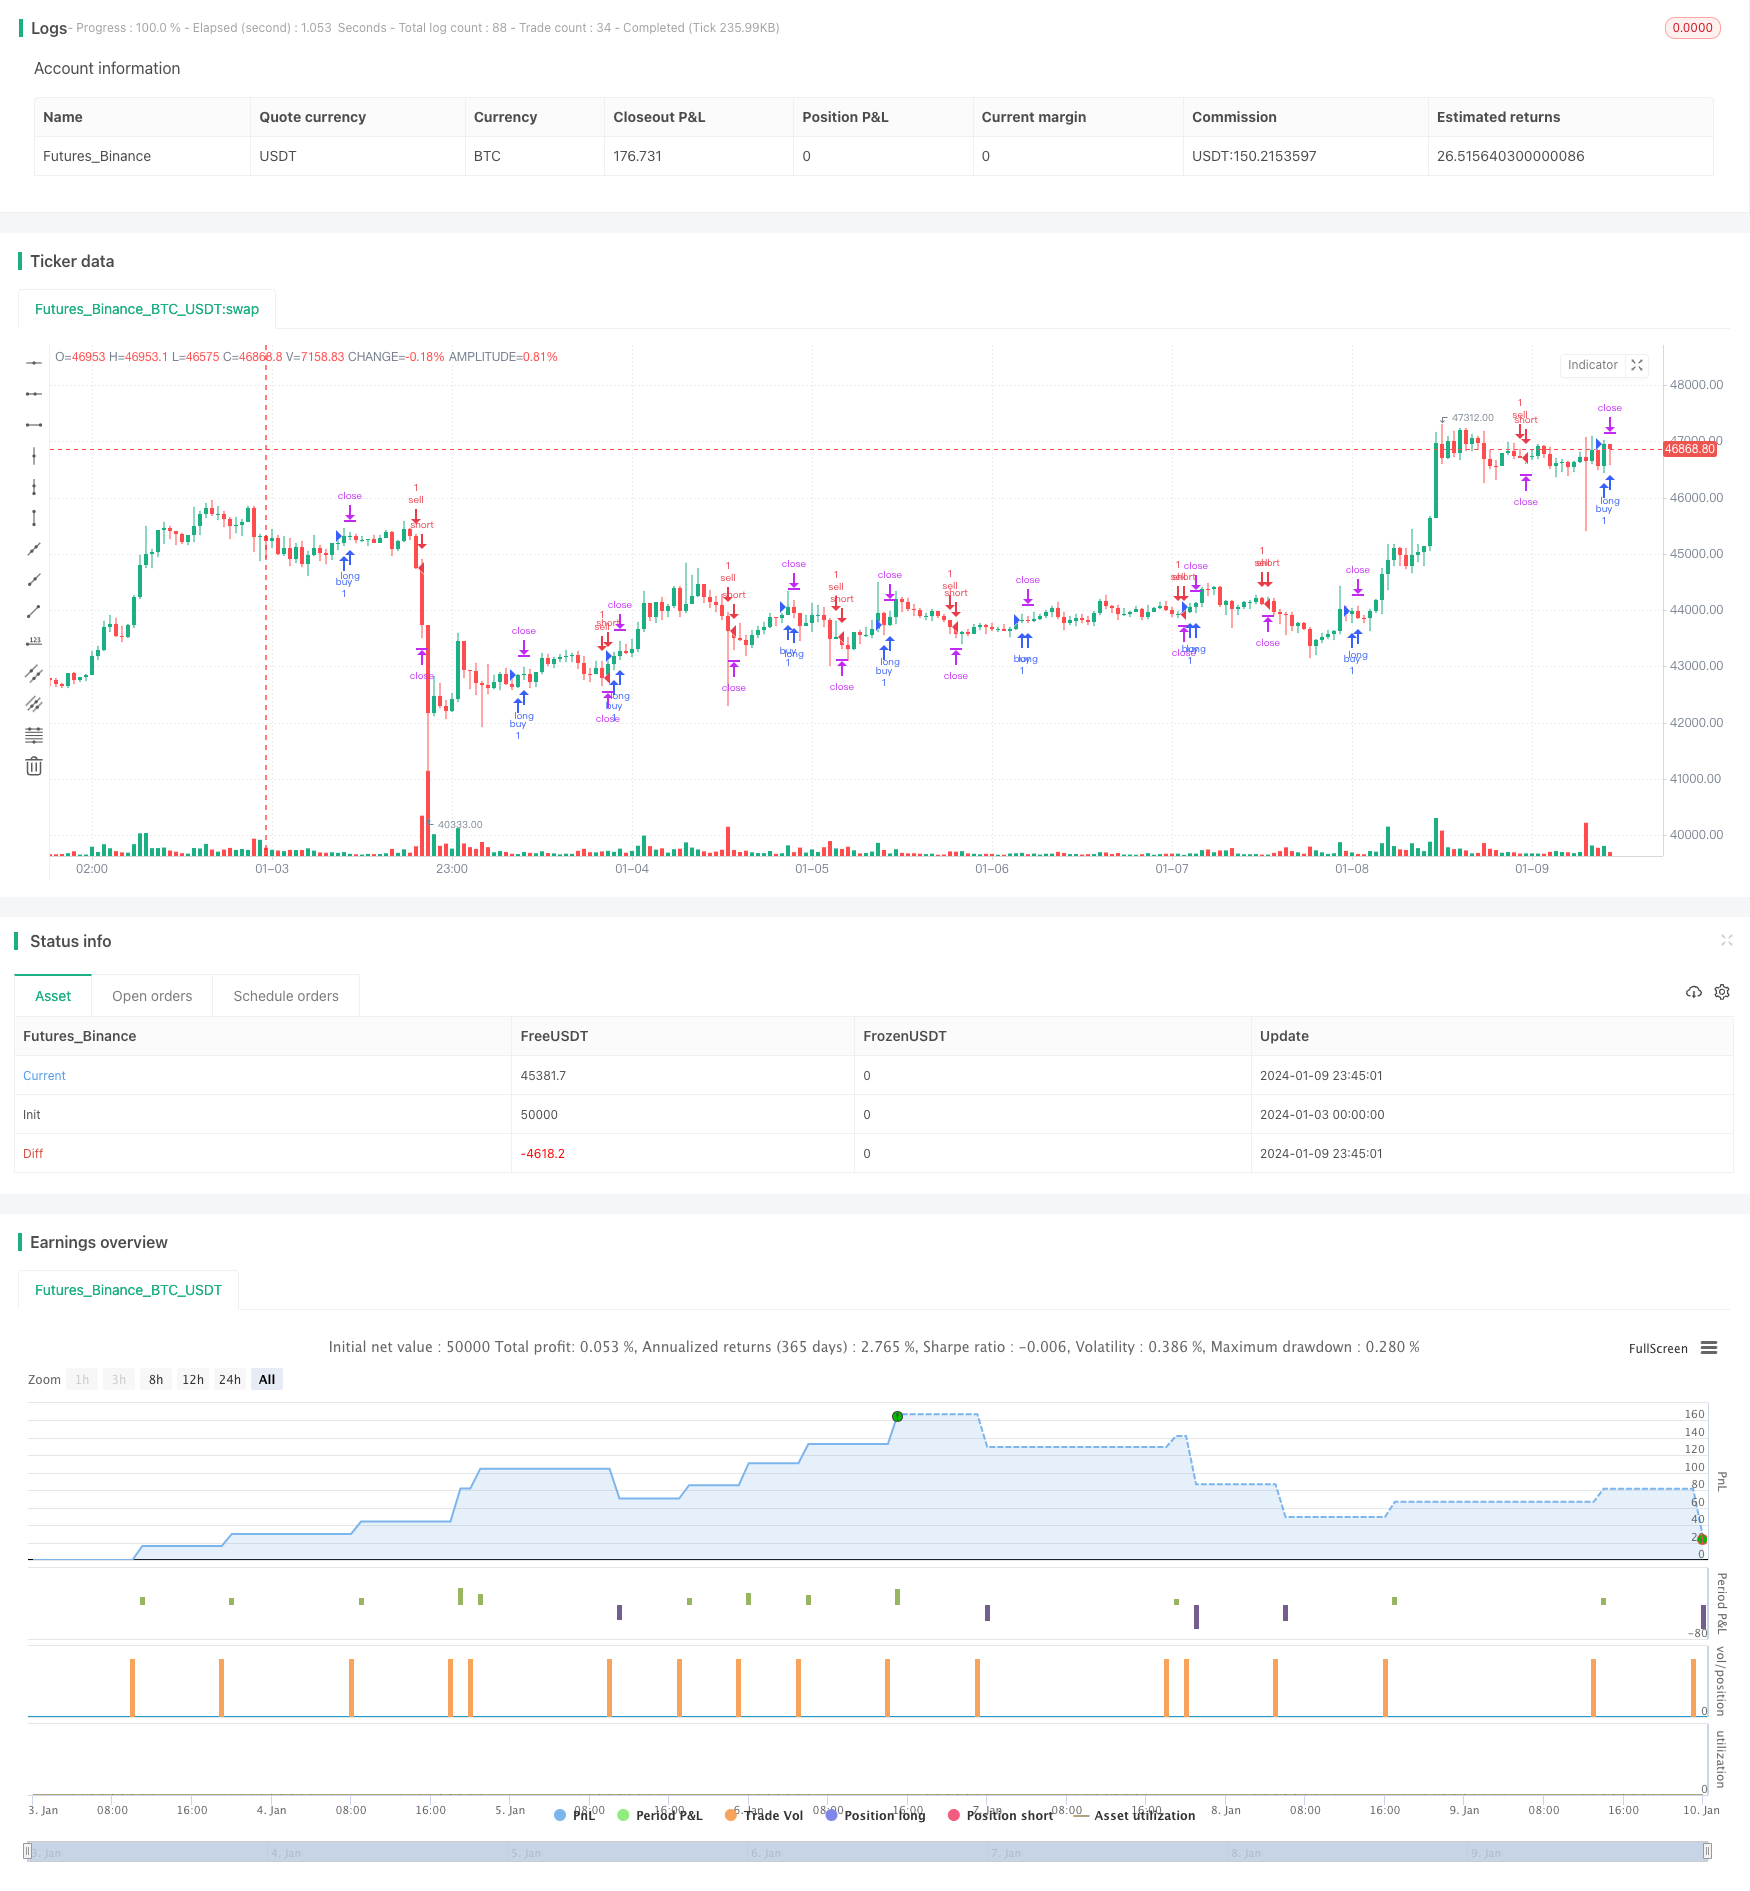
/*backtest
start: 2024-01-03 00:00:00
end: 2024-01-10 00:00:00
period: 45m
basePeriod: 5m
exchanges: [{"eid":"Futures_Binance","currency":"BTC_USDT"}]
*/

// inspiration script from: @ahmad_naquib
// inspiration script link: https://www.tradingview.com/script/tGTV8MkY-Two-Take-Profits-and-Two-Stop-Loss/
// inspiration strategy script name: Two Take Profits and Two Stop Loss


////////////
// Do not use this strategy, it's just an exmaple !! The goal from this script is to show you TP and SL based on PIPS
////////////


//@version=5
strategy('SL & TP based on Pips', "PIP SL & TP", overlay=true, initial_capital=1000)

// MA
ema_period = input(title='EMA period', defval=10)
wma_period = input(title='WMA period', defval=20)
ema = ta.ema(close, ema_period)
wma = ta.wma(close, wma_period)

// Entry Conditions
long = ta.crossover(ema, wma) and nz(strategy.position_size) == 0
short = ta.crossunder(ema, wma) and nz(strategy.position_size) == 0

// Pips Calculation
pip1 = input(20, title = "TP PIP", group = "PIP CALCULATION") * 10 * syminfo.mintick
pip2 = input(20, title = "SL PIP", group = "PIP CALCULATION") * 10 * syminfo.mintick

// Trading parameters
var bool LS = na
var bool SS = na

var float EP = na // Entry Position
var float TVL = na
var float TVS = na
var float TSL = na
var float TSS = na

var float TP1 = na
//var float TP2 = na
var float SL1 = na
///var float SL2 = na

// SL & TP Values
// there's also SL2 and TP2 in case you want to add them to your script,
//also you can add a break event in the strategy.entry section.

if short or long and strategy.position_size == 0
    EP := close
    SL1 := EP - pip2 * (short ? -1 : 1)
    //SL2 := EP - pip2 * (short ? -1 : 1)

    TP1 := EP + pip1 * (short ? -1 : 1)
    //TP2 := EP + pip1 * 2 * (short ? -1 : 1)


// current trade direction
LS := long or strategy.position_size > 0
SS := short or strategy.position_size < 0

// adjust trade parameters and trailing stop calculations
TVL := math.max(TP1, open) - pip1[1]
TVS := math.min(TP1, open) + pip1[1]
TSL := open[1] > TSL[1] ? math.max(TVL, TSL[1]) : TVL
TSS := open[1] < TSS[1] ? math.min(TVS, TSS[1]) : TVS

//if LS and high > TP1
    //if open <= TP1
        //SL2 := math.min(EP, TSL)

//if SS and low < TP1
    //if open >= TP1
        //SL2 := math.max(EP, TSS)


// Closing conditions
// and those are a closing conditions in case you want to add them.

//close_long = LS and open < SL2
//close_short = SS and open > SL2

// Buy
if (long and not SS)
    strategy.entry('buy', strategy.long)
strategy.exit('exit1', from_entry='buy', stop=SL1, limit=TP1, qty_percent=100)
//strategy.exit('exit2', from_entry='buy', stop=SL2, limit=TP2)

// Sell
if (short and not LS)
    strategy.entry('sell', strategy.short)
strategy.exit('exit3', from_entry='sell', stop=SL1, limit=TP1, qty_percent=100)
//strategy.exit('exit4', from_entry='sell', stop=SL2, limit=TP2)

// Plots
// those are plots for the lines of The tp and sl. they are really useful, and in the next update I will use a filling option.

a = plot(strategy.position_size > 0 ? SL1 : na, color=color.new(#af0829, 30), linewidth = 2, style=plot.style_linebr)
b = plot(strategy.position_size < 0 ? SL1 : na, color=color.new(#af0829, 30), linewidth = 2, style=plot.style_linebr)

c = plot(strategy.position_size > 0 ? TP1 : na, color=color.new(#2e7e00, 30), linewidth = 2, style=plot.style_linebr)
d = plot(strategy.position_size < 0 ? TP1 : na, color=color.new(#2e7e00, 30), linewidth = 2, style=plot.style_linebr)

g = plot(strategy.position_size >= 0 ? na : EP, color=color.new(#ffffff, 50), style=plot.style_linebr)
h = plot(strategy.position_size <= 0 ? na : EP, color=color.new(#ffffff, 50), style=plot.style_linebr)


// those are plot for the TP2 and SL2, they are optional if you want to add them.

//e = plot(strategy.position_size > 0 ? TP2 : na, color=color.new(#00ced1, 0), style=plot.style_linebr)
//f = plot(strategy.position_size < 0 ? TP2 : na, color=color.new(#00ced1, 0), style=plot.style_linebr)


//those are the plot for the ema and wma strategy for short and long signal. they are not really a good strategy, I just used them as an example
//but you have the option to plot them or not.
// do not use this strategy, it's just an exmaple !! The goal from this script is to show you TP and SL based on PIPS

//plot(ema, title='ema', color=color.new(#fff176, 0))
//plot(wma, title='wma', color=color.new(#00ced1, 0))