定量的デュアルファクター反転慣性取引戦略
概要
量子二因子逆転慣性取引戦略 (Quant Dual Factor Reversal Inertia Trading Strategy) は,価格逆転信号と市場慣性信号を組み合わせた量子取引戦略である.この戦略は,まず,ランダムな指標を使用して価格逆転信号を実現し,次に相対的な変動率指標の市場慣性信号と組み合わせて,最終的に二因子駆動の取引決定を実現する.
戦略原則
この戦略は主に2つの部分に基づいています.
価格逆転は,ウルフ・ジェンセン (Ulf Jensen) が彼の著作で提唱した考え方を部分的に採用しています.具体的には,閉盘価格が2日連続で上昇し,9日のスローストキャスティック指標が50を下回ったとき,多めに行います.閉盘価格が2日連続で低下し,9日のファストストキャスティック指標が50を下回ったとき,空きを行います.
市場慣性部分は相対波動率指標 ((RVI) を採用する.この指標値は0から100の間で波動し,50以上は市場の長期傾向が上昇していることを示し,50未満は市場の長期傾向が低下していることを示している.
全体として,この戦略は,価格逆転信号と市場慣性信号を統合し,最終的に現在の市場の方向を判断する.
優位分析
この戦略の最大の利点は,反転とトレンドの2つの取引理念を組み合わせることにある.反転シグナルは,短期的な調整を捕捉して取引機会を提供する.慣性シグナルは,長期のトレンドが一致するときにのみポジションを開くことを保証し,ノイズを効果的にフィルターします.
さらに,二因子ドライブは信号品質を向上させ,ストキャスティック指標パラメータ最適化とRVI平滑最適化も戦略最適化に余地を与えます.
リスク分析
この戦略の主なリスクは,
逆転信号の認識が不正確なリスク.パラメータが合理的かどうかを検証する必要がある.
慣性信号が誤信号を発するリスク。RVI指標自体には遅延があり,平滑パラメータの調整が必要。
双因子シグナル時間の不適切なマッチング,取引機会を逃すリスク.異なるパラメータの下でマッチングをテストする必要がある.
また,逆転策は,トレンド市場の下での損失の増大のリスクがあります. ストップ・ロスの規則を厳格に遵守する必要があります.
最適化の方向
この戦略は以下の点で最適化できます.
ストカスティック指標のパラメータを最適化し,反転信号の質と時効性を識別する.
RVI指標の平滑パラメータを最適化し,慣性判断の正確性を向上させる.
ポジション保持時間の違いをテストし,最適なポジション保持周期を決定する.
止損メカニズムに参加する.異なる止損点を再測し,最適の止損位置を見つける.
取引量の異動など,他の要因信号を加えることを考慮して,多要因駆動を形成することができる.
要約する
量化二因子反転慣性取引戦略は,反転とトレンド因子を総合的に考慮し,ストキャスティック指標とRVI指標を使用して取引信号を生成する.戦略は,二因子駆動,反転機会キャプチャ,および信号フィルタリングなどの利点を持ち,多面的なパラメータの最適化によりさらに改善することができる.リスク管理は特に重要であり,厳格にストップロスを実行する必要があります.この戦略は量化取引のための良い考えを提供します.
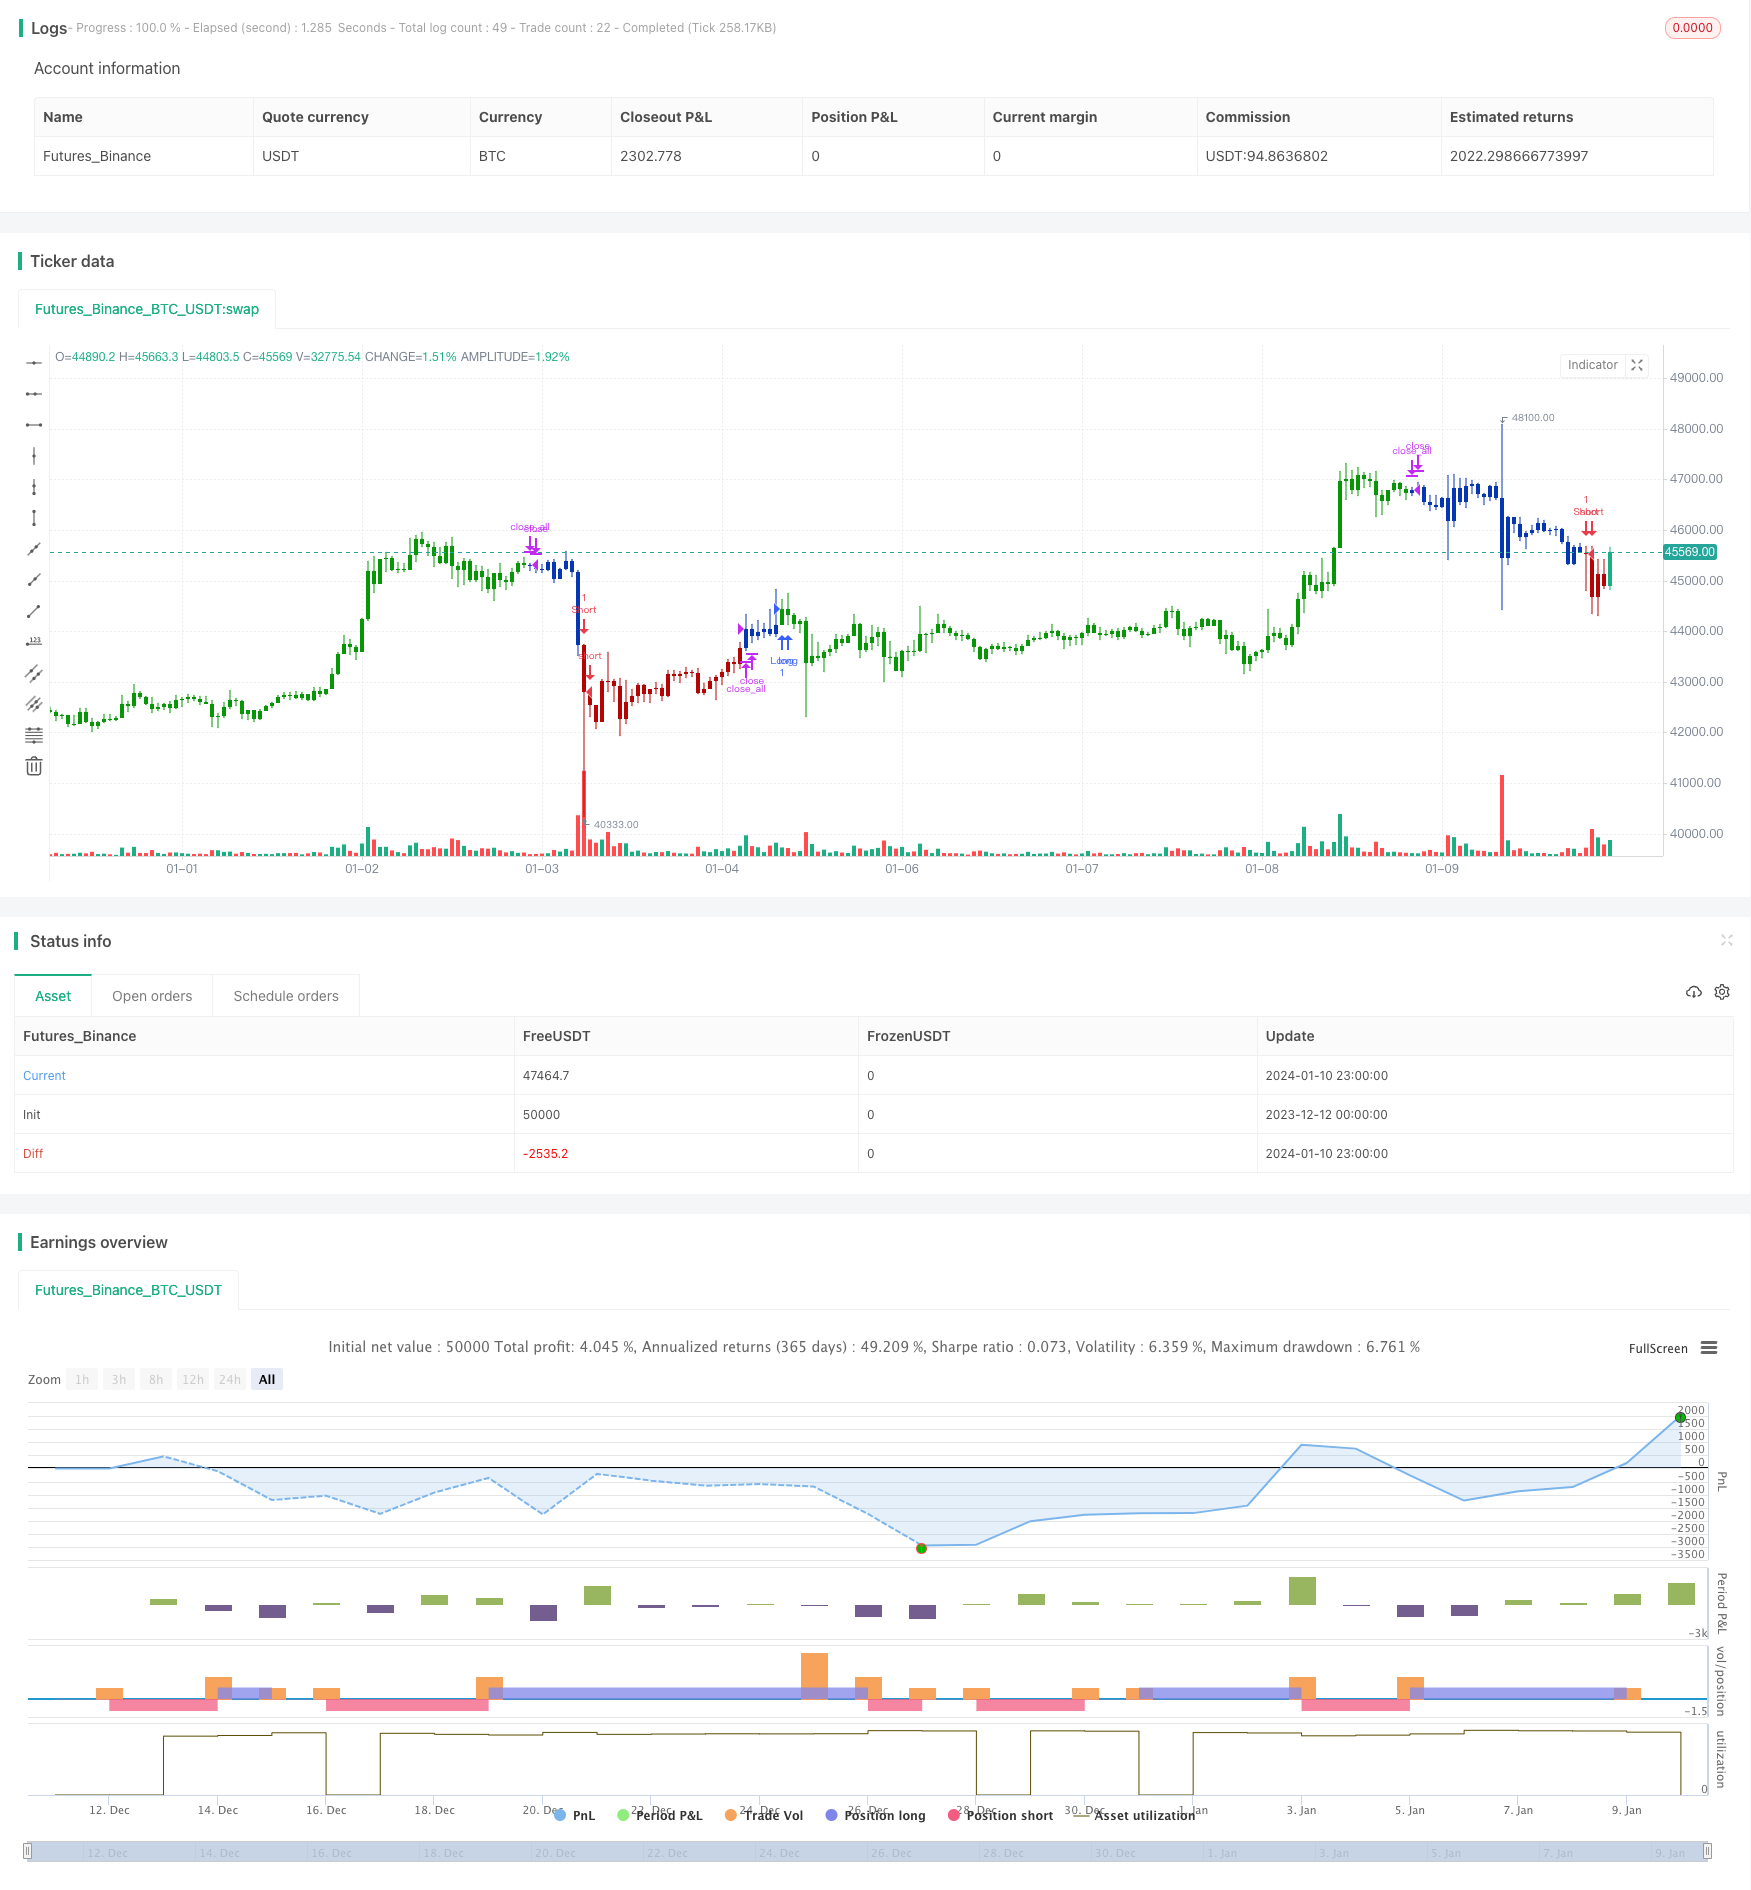
/*backtest
start: 2023-12-12 00:00:00
end: 2024-01-11 00:00:00
period: 1h
basePeriod: 15m
exchanges: [{"eid":"Futures_Binance","currency":"BTC_USDT"}]
*/

//@version=4
////////////////////////////////////////////////////////////
//  Copyright by HPotter v1.0 27/11/2020
// This is combo strategies for get a cumulative signal.
//
// First strategy
// This System was created from the Book "How I Tripled My Money In The
// Futures Market" by Ulf Jensen, Page 183. This is reverse type of strategies.
// The strategy buys at market, if close price is higher than the previous close
// during 2 days and the meaning of 9-days Stochastic Slow Oscillator is lower than 50.
// The strategy sells at market, if close price is lower than the previous close price
// during 2 days and the meaning of 9-days Stochastic Fast Oscillator is higher than 50.
//
// Second strategy
// The inertia indicator measures the market, stock or currency pair momentum and
// trend by measuring the security smoothed RVI (Relative Volatility Index).
// The RVI is a technical indicator that estimates the general direction of the
// volatility of an asset.
// The inertia indicator returns a value that is comprised between 0 and 100.
// Positive inertia occurs when the indicator value is higher than 50. As long as
// the inertia value is above 50, the long-term trend of the security is up. The inertia
// is negative when its value is lower than 50, in this case the long-term trend is
// down and should stay down if the inertia stays below 50.
//
// You can change long to short in the Input Settings
// Please, use it only for learning or paper trading. Do not for real trading.
//
// WARNING:
// - For purpose educate only
// - This script to change bars colors.
////////////////////////////////////////////////////////////
Reversal123(Length, KSmoothing, DLength, Level) =>
    vFast = sma(stoch(close, high, low, Length), KSmoothing)
    vSlow = sma(vFast, DLength)
    pos = 0.0
    pos := iff(close[2] < close[1] and close > close[1] and vFast < vSlow and vFast > Level, 1,
	         iff(close[2] > close[1] and close < close[1] and vFast > vSlow and vFast < Level, -1, nz(pos[1], 0)))
	pos

Inertia(Period, Smooth) =>
    pos = 0.0
    nU = 0.0
    nD = 0.0
    xPrice = close
    StdDev = stdev(xPrice, Period)
    d = iff(close > close[1], 0, StdDev)
    u = iff(close > close[1], StdDev, 0)
    nU := (13 * nz(nU[1],0) + u) / 14
    nD := (13 * nz(nD[1],0) + d) / 14
    nRVI = 100 * nU / (nU + nD)
    nRes = ema(nRVI, Smooth)
    pos :=iff(nRes > 50, 1,
    	   iff(nRes < 50, -1, nz(pos[1], 0)))
    pos

strategy(title="Combo Backtest 123 Reversal & Inertia Strategy", shorttitle="Combo", overlay = true)
Length = input(14, minval=1)
KSmoothing = input(1, minval=1)
DLength = input(3, minval=1)
Level = input(50, minval=1)
//-------------------------
Period = input(10, minval=1)
Smooth = input(14, minval=1)
reverse = input(false, title="Trade reverse")
posReversal123 = Reversal123(Length, KSmoothing, DLength, Level)
posInertia = Inertia(Period, Smooth)
pos = iff(posReversal123 == 1 and posInertia == 1 , 1,
	   iff(posReversal123 == -1 and posInertia == -1, -1, 0))
possig = iff(reverse and pos == 1, -1,
          iff(reverse and pos == -1 , 1, pos))
if (possig == 1)
    strategy.entry("Long", strategy.long)
if (possig == -1)
    strategy.entry("Short", strategy.short)
if (possig == 0)
    strategy.close_all()
barcolor(possig == -1 ? #b50404: possig == 1 ? #079605 : #0536b3 )