マルチタイムラインの共同取引戦略
概要
マルチタイム軸協同取引戦略 (MT-Coordination Trading Strategy) は,高度な量化取引戦略である.これは,複数の技術指標を統合し,市場の短期取引機会を識別することができる.この戦略は,有名なトレーダーI3ig_Tradesによって設計され,金融市場の高周波取引に専用である.
戦略原則
この戦略は,3つの異なる周期の平滑移動平均 ((21日線,50日線,200日線),相対的に強い指数 ((14日RSI) とウィリアム指標 ((2日)) を融合しています. 具体的取引の論理は以下の通りです.
多頭入場シグナル:閉盘価格が3つの平均線より高く,RSIが50より高く,現在のK線の最高価格が上記のK線の上方三角より高いとき,多ポジションを開く.
空頭入場シグナル:閉店価格が3つの平均線より低く,RSIが50より低く,現在のK線の最低価格が上記のK線の下向き三角より低いとき.このとき,空席を開く.
ポジションのサイズは,選択したパーセントとレバレッジレベルの動向に基づいて計算されます.
優位分析
この戦略は,複数の指標を組み合わせて偽信号をフィルターし,高確率のブレークアウトポイントの入場点を見つけ,取引リスクを大幅に軽減します.同時に,ポジションは,口座権益の一定比率に従って設定され,単一損失を制御します.
具体的には
複数のタイム軸の指標を使用して確認し,套装を避ける. 短線,中線,長線均線は,異なるレベルのトレンドを識別できる.
RSIは,過熱過冷区域の取引を避けます. RSIが50を超えれば,看多信号,50を下回れば空頭信号です.
ウィリアム指数はさらに突破を検証する. 価格がその指数の極限点を突破したときにのみ入場する.
ダイナミックポジションは,口座金額のパーセントで計算され,単一の損失を厳格に制御します.
異なる取引スタイルに対応するカスタマイズ可能なパラメータ
リスク分析
この戦略には以下のリスクがあります.
3つの均線が離れている場合,取引がセットされる可能性があります.
トレンドが逆転する前には出場できない.指標が遅れているため,逆転が予測できない.
損失の危険性 oom 極端な状況では,単独の損失は想定以上に増加します.
対策として
- 均線組合せを最適化して,最適なパラメータを見つけます.
- 陽線陰線フィルターを追加して,偽突破をさらに回避する.
- パーセンテージとレバレッジレベルを適正に調整する.
最適化の方向
この戦略は以下の側面から最適化できます.
異なる平均線とRSIパラメータの組み合わせをテストし,最適なパラメータを見つけます.
トレンドのトレードジャックの信号をさらに識別するために,BTCの幅などの他のフィルタリング指標を追加します.
損失の一定比率に達したときに止まる.
ディープ・ラーニング・モデルと組み合わせて, キー・サポート・レジスタンスを判断する.
ポジションのサイズを合理的にするために,自主パーセンテージポジション管理システムを使用します.
要約する
多時間軸協同取引戦略は,成熟した高周波突破策である.複数の指標を融合して偽信号を軽減し,ダイナミックなポジションで単一の損失を厳格に制御する.この戦略は,一定規模の資金を持つ私募基金とプロフェッショナルトレーダーの使用に適しています.パラメータとモデルを継続的に最適化することで,長期にわたる安定した利益を得ることができます.
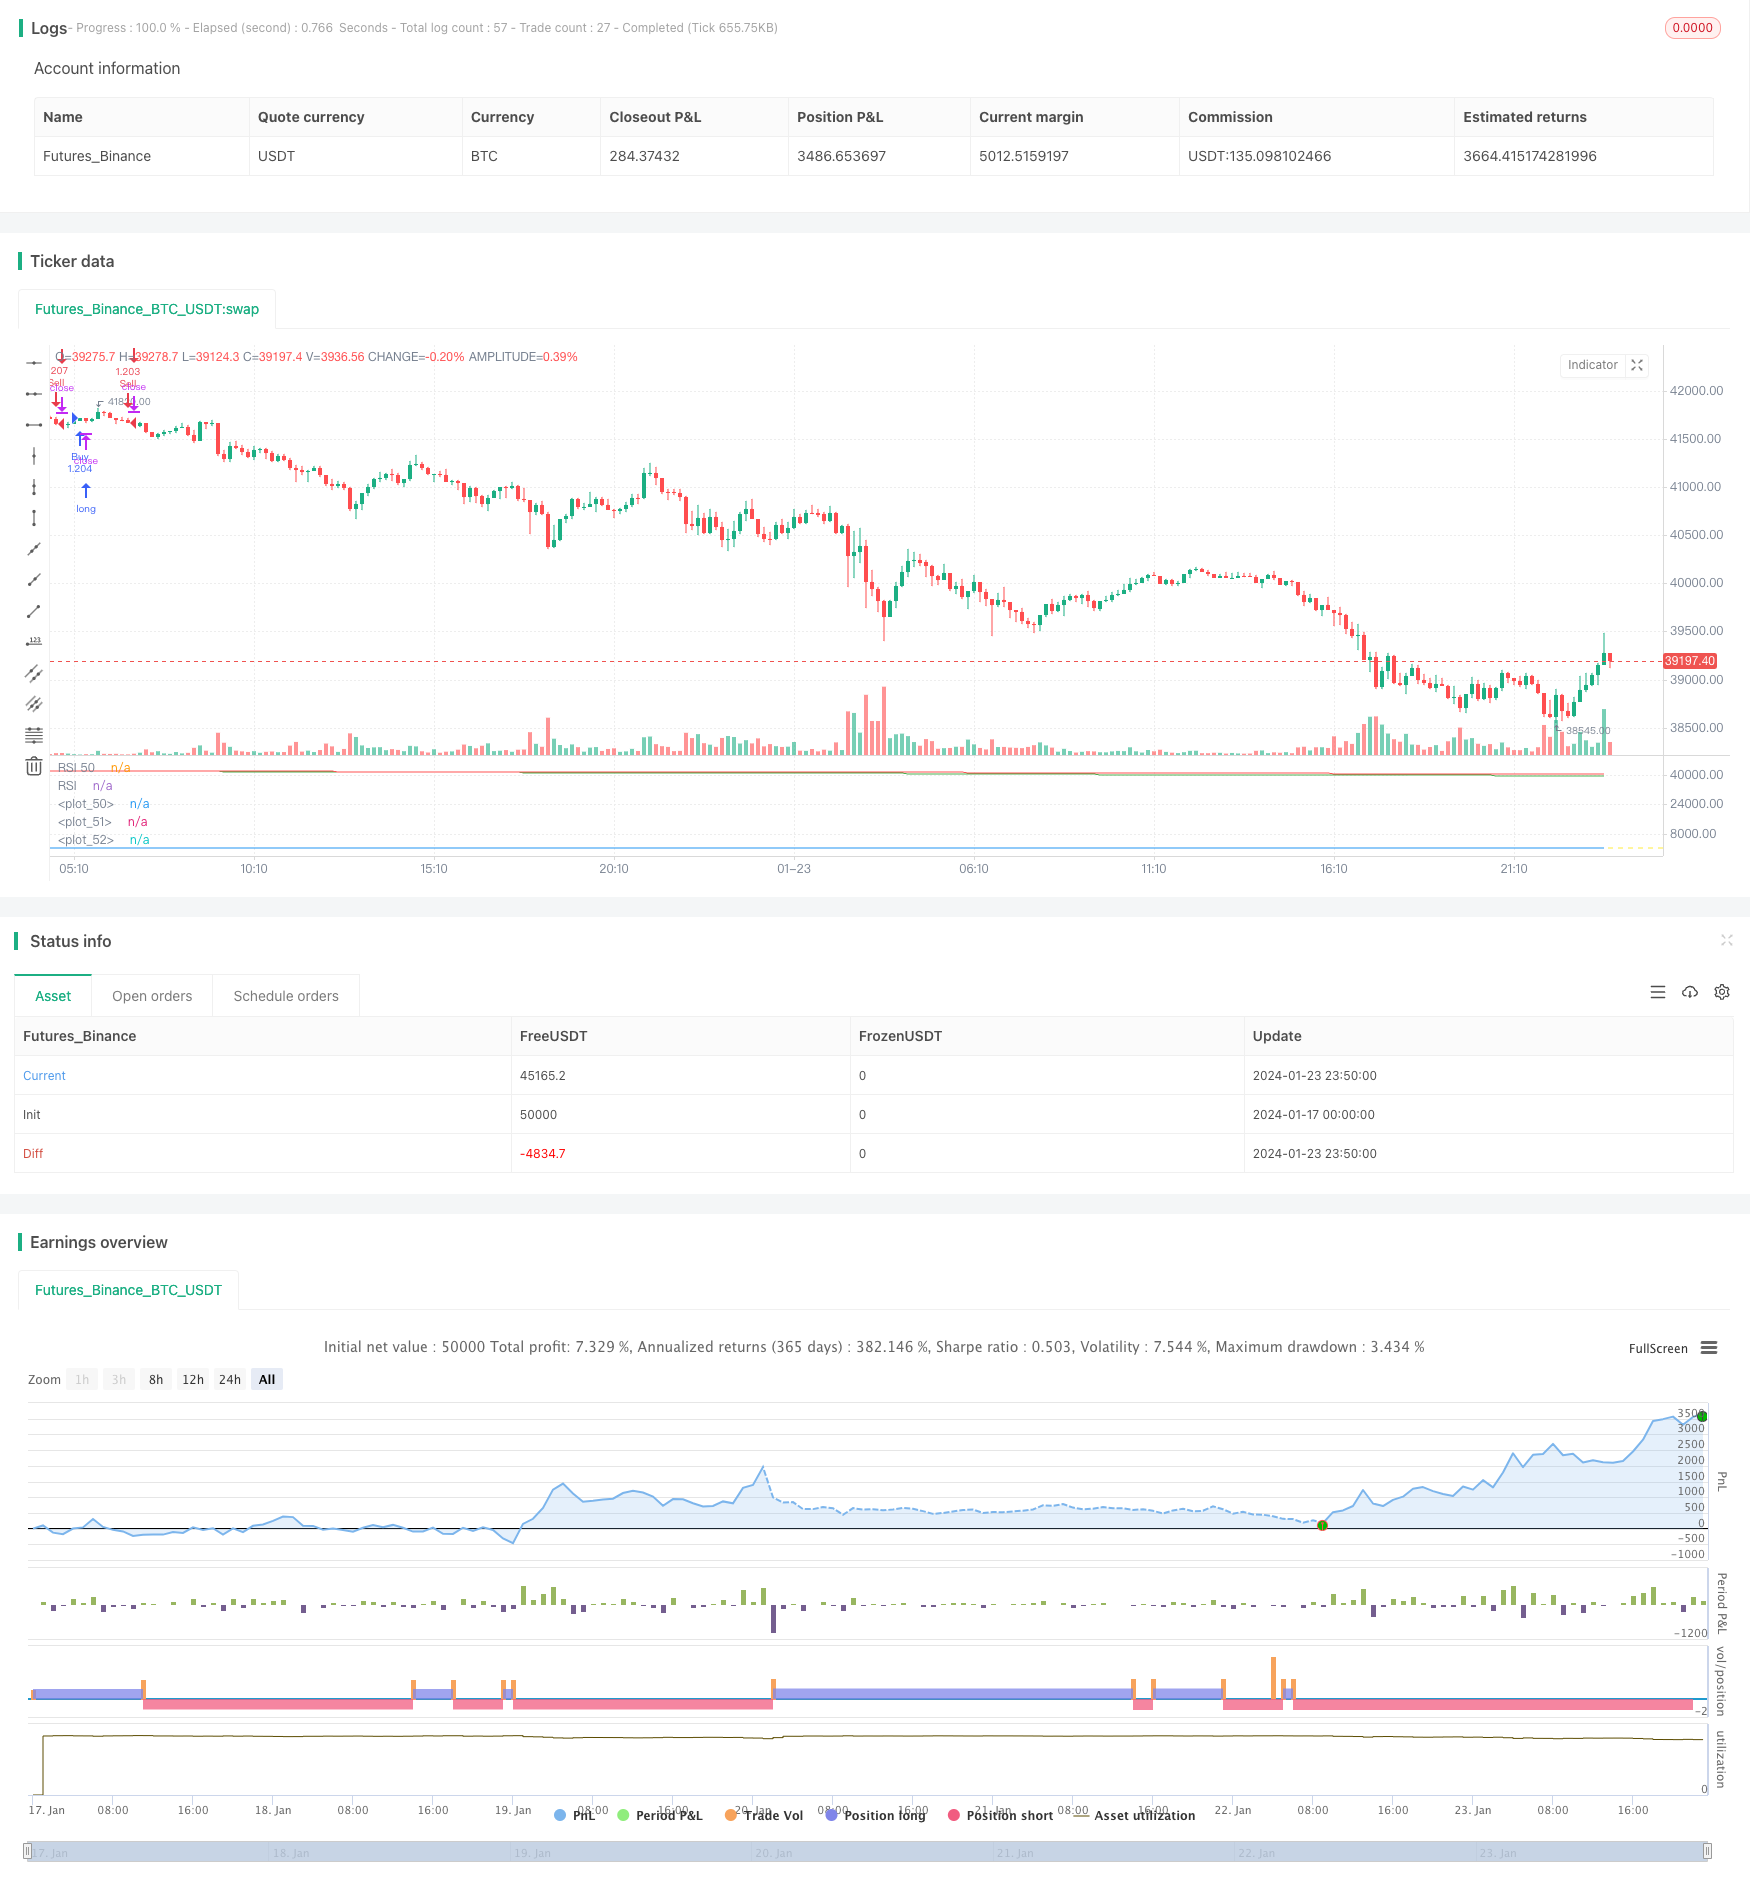
/*backtest
start: 2024-01-17 00:00:00
end: 2024-01-24 00:00:00
period: 10m
basePeriod: 1m
exchanges: [{"eid":"Futures_Binance","currency":"BTC_USDT"}]
*/

//@version=5
// Written by I3ig_Trades. Follow And Let Me Know Any Strategies You'd Like To See!
strategy("Best Scalping Strategy Period (TMA)", shorttitle="Best Scalping Strategy Period (TMA)", overlay=false,
         initial_capital=100000,
         default_qty_type=strategy.percent_of_equity,
         default_qty_value=100)

// Leverage Input
leverage = input.float(1, title="Leverage", minval=1, step=0.1)

// Calculate position size based on the percentage of the portfolio and leverage
percentOfPortfolio = input.float(100, title="Percent of Portfolio")

// Define input options
rsiLength = input.int(14, title="RSI Length", minval=1)
williamsLength = input.int(2, title="Williams Fractals Length", minval=1)
sma21Length = input.int(21, title="SMA 21 Length", minval=1)
sma50Length = input.int(50, title="SMA 50 Length", minval=1)
sma200Length = input.int(200, title="SMA 200 Length", minval=1)

// Smoothed Moving Averages
sma21 = ta.sma(close, sma21Length)
sma50 = ta.sma(close, sma50Length)
sma200 = ta.sma(close, sma200Length)

// RSI
rsiValue = ta.rsi(close, rsiLength)

// Williams Fractals
fractalUp = ta.highest(close, williamsLength)
fractalDown = ta.lowest(close, williamsLength)

// Conditions for Buy Entry
buyCondition = close > sma21 and close > sma50 and close > sma200 and rsiValue > 50 and high > fractalUp[1]

// Conditions for Sell Entry
sellCondition = close < sma21 and close < sma50 and close < sma200 and rsiValue < 50 and low < fractalDown[1]

positionSizePercent = percentOfPortfolio / 100 * leverage
positionSize = strategy.equity * positionSizePercent / close

// Executing strategy with dynamic position size
if buyCondition
    strategy.entry("Buy", strategy.long, qty=positionSize)

if sellCondition
    strategy.entry("Sell", strategy.short, qty=positionSize)

// Plotting the Smoothed Moving Averages
plot(sma21, color=color.white)
plot(sma50, color=color.green)
plot(sma200, color=color.red)

// Plotting RSI and Fractals for visual confirmation
hline(50, "RSI 50", color=color.yellow)
plot(rsiValue, color=color.blue, title="RSI")

// Input text boxes for trading actions
var buy_entry_params = input("", title="Buy Entry Parameters")
var buy_exit_params = input("", title="Buy Exit Parameters")
var sell_entry_params = input("", title="Sell Entry Parameters")
var sell_exit_params = input("", title="Sell Exit Parameters")