DMIとRSIに基づくトレンドフォロー戦略
作成日:
2024-01-25 15:56:41
最終変更日:
2024-01-25 15:56:41
コピー:
0
クリック数:
1261
1
フォロー
1751
フォロワー
##概要 この戦略は,DMI指標がトレンド方向を判断し,RSI指標が超買い超売りを判断するとの組み合わせで,より完全なトレンドフォロー取引戦略を実現する.DMI指標がトレンドを判断し,RSI指標が超買いまたは超売りを示している場合は,相応にオーバーまたは空売りする.同時に,利益をロックするために移動のストップを設定する.
戦略の原則
- DMIの指数でトレンドの方向を判断する
- DMIは3つの曲線で構成されています:+DIは上昇傾向を示し,-DIは下降傾向を示し,ADXはトレンドの強さを判断します
- +DI>-DIが上昇傾向であるとき,多めに; -DI>+DIが下降傾向であるとき,空白に
- RSIで 超買いと超売りを判断する
- RSIは,期間中の平均的な終盤の上昇と低下を比較して,過買か過売かを判断します.
- RSIが30を下回ると,超売り,70を下回ると,超買いになります.
- DMIがトレンドの方向を判断し,RSIが超買いと超売りを判断することで,市場のリズムを把握できます.
- DMIは上昇傾向とRSIの超売りを判断し,より良い時間のために多額の取引を行う
- DMIは下落傾向とRSIの過剰買いを判断し,空白の良いタイミングとして
- 移動ストップを設定して利益をロックします.
優位分析
これはより成熟した安定したトレンドフォロー戦略で,以下の利点があります.
- トレンド判断と超買超売判断を組み合わせて,波動的な市場で頻繁に取引を避ける
- 流行指標DMIとRSIを使用し,パラメータの選択が簡単で,実用検証が充実している
- 移動式ストップを設定して利益をロックし,ストップを一定程度回避できます.
- 規則は明確で分かりやすく,手順はシンプルで,実行しやすい.
リスク分析 この戦略にはいくつかのリスクがあります.
- DMIとRSIは偽信号を発生し,不必要な損失を引き起こす可能性があります.
- 移動停止設定が正しくない場合,遅すぎたり,大きすぎたりする
- 震えをフィルターできず 閉じ込められやすい
- トレンド戦略に従えば,トレンドが逆転したときに,すぐに止まらない.
方向を最適化する
この戦略は,以下の点で最適化できます.
- 波動率指数フィルターによる振動
- candleの形状判断を組み合わせて,偽突破を避ける
- 重要なサポート抵抗の位置の近くに適切なストップ・ローズ・制限を設定する
- 機械学習モデルの傾向を判断するython
- 動的にDMIとRSIを最適化するパラメータ
結論から言うと この戦略は,DMIによってトレンドの方向を判断し,RSIによってオーバーバイとオーバーセールを判断し,中長線の取引機会を把握する.同時に,利益をロックするために移動のストップを設定する.この戦略のパラメータ選択は単純で,取引規則は明確で,実行しやすい.しかし,足らないタイミングでセットアップとストップされるリスクもあります.いくつかのパラメータとモデルを最適化することで,この戦略の効果を向上させることができます.
ストラテジーソースコード
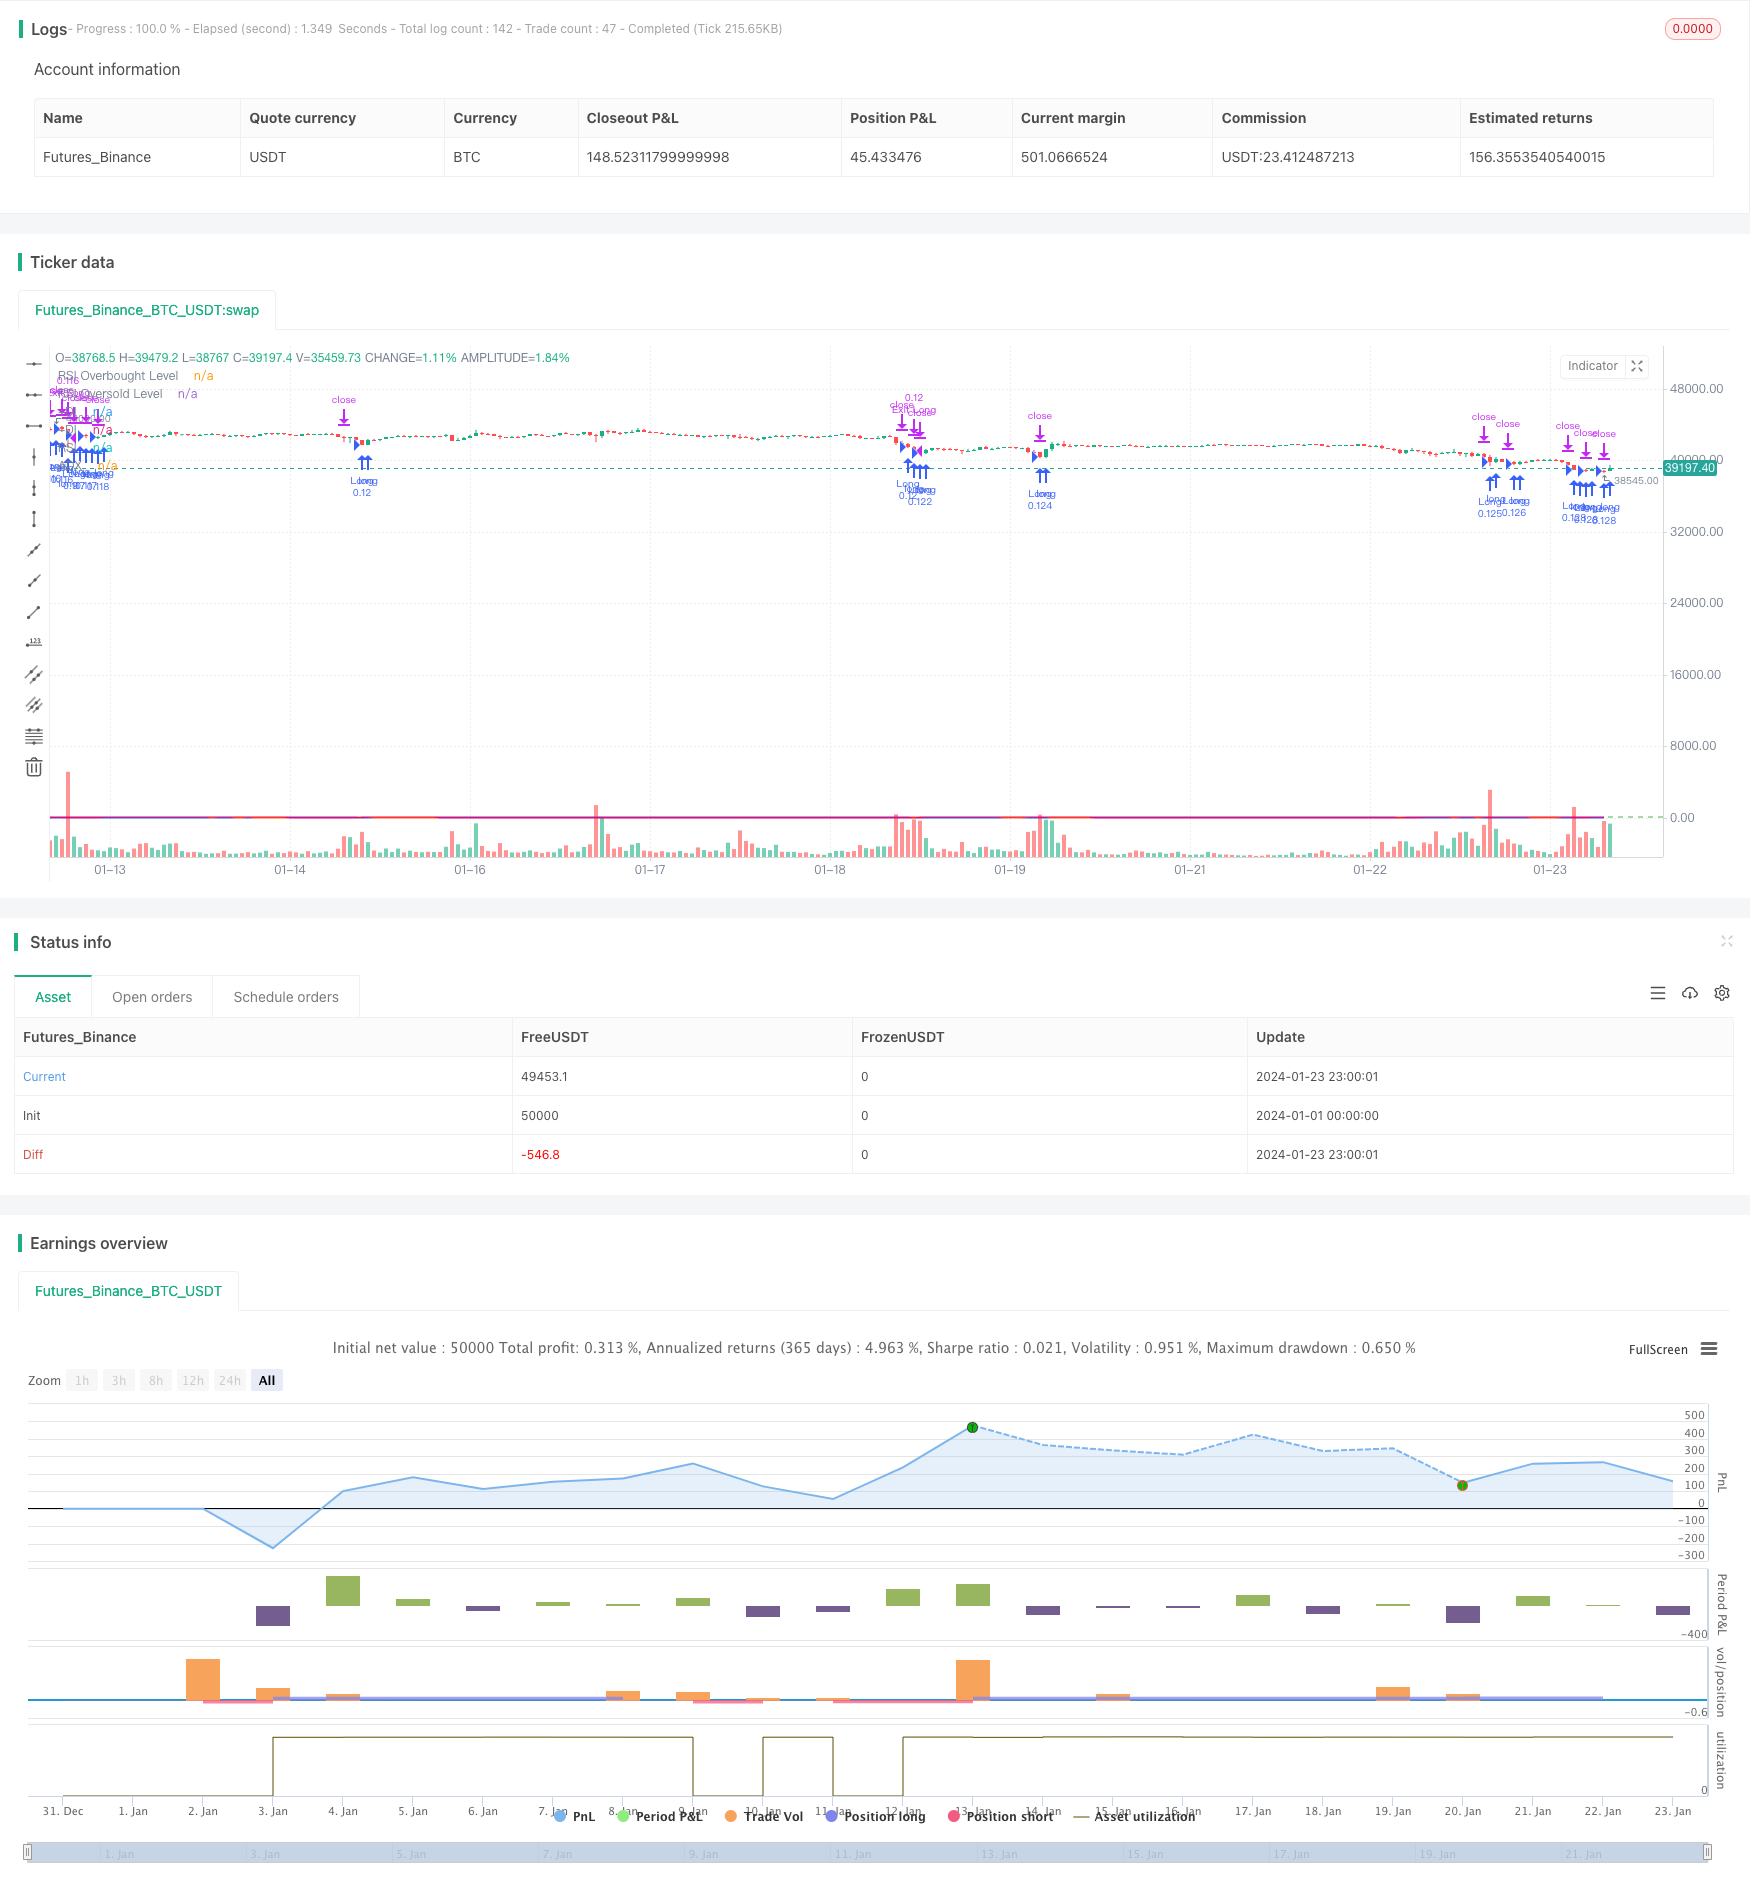
/*backtest
start: 2024-01-01 00:00:00
end: 2024-01-24 00:00:00
period: 1h
basePeriod: 15m
exchanges: [{"eid":"Futures_Binance","currency":"BTC_USDT"}]
*/

// This Pine Script™ code is subject to the terms of the Mozilla Public License 2.0 at https://mozilla.org/MPL/2.0/
// © YingYangJPN

//@version=5
strategy("DMI and RSI Strategy", overlay=true, initial_capital=10000, default_qty_type=strategy.percent_of_equity, default_qty_value=10)

// DMI indikatörünü tanımlayalım
lensig = input.int(14, title="ADX Smoothing", minval=1, maxval=50)
len = input.int(14, minval=1, title="DI Length")
up = ta.change(high)
down = -ta.change(low)
plusDM = na(up) ? na : (up > down and up > 0 ? up : 0)
minusDM = na(down) ? na : (down > up and down > 0 ? down : 0)
trur = ta.rma(ta.tr, len)
plus = fixnan(100 * ta.rma(plusDM, len) / trur)
minus = fixnan(100 * ta.rma(minusDM, len) / trur)
sum = plus + minus
adx = 100 * ta.rma(math.abs(plus - minus) / (sum == 0 ? 1 : sum), lensig)
trailing_stop_loss_factor = input.float(0.50, "Trailing Stop Loss Factor", step = 0.01)

// RSI indikatörünü tanımlayalım
rsiLength = input.int(14, minval=1, title="RSI Length")
rsiSource = input(close, title="RSI Source")
rsiOverbought = input.int(70, title="RSI Overbought Level")
rsiOversold = input.int(30, title="RSI Oversold Level")
rsiValue = ta.rsi(rsiSource, rsiLength)

// Uzun pozisyon açma koşullarını tanımlayalım
longCondition1 = rsiValue < rsiOversold // RSI oversold seviyesinin altındaysa
longCondition2 = adx > 20 // ADX 20'den büyükse
longCondition3 = minus > plus

// Kısa pozisyon açma koşullarını tanımlayalım
shortCondition1 = rsiValue > rsiOverbought // RSI overbought seviyesinin üstündeyse
shortCondition2 = adx > 20 // ADX 20'den büyükse
shortCondition3 = plus > minus

// Uzun pozisyon açalım
if longCondition1 and longCondition2 and longCondition3
    strategy.entry("Long", strategy.long)


// Kısa pozisyon açalım
if shortCondition1 and shortCondition2 and shortCondition3
    strategy.entry("Short", strategy.short)

// Trailing Stop Loss
longTrailingStopLoss = strategy.position_avg_price * (1 - trailing_stop_loss_factor / 100)
shortTrailingStopLoss = strategy.position_avg_price * (1 + trailing_stop_loss_factor / 100)
if strategy.position_size > 0
    strategy.exit("Exit Long", "Long", stop  = longTrailingStopLoss)
if strategy.position_size < 0
    strategy.exit("Exit Short", "Short", stop = shortTrailingStopLoss)

// DMI ve RSI indikatörlerini grafiğe çizelim
plot(adx, color=#F50057, title="ADX")
plot(plus, color=#2962FF, title="+DI")
plot(minus, color=#FF6D00, title="-DI")
plot(rsiValue, color=#9C27B0, title="RSI")
hline(rsiOverbought, title="RSI Overbought Level", color=#E91E63, linestyle=hline.style_dashed)
hline(rsiOversold, title="RSI Oversold Level", color=#4CAF50, linestyle=hline.style_dashed)