移動平均とストキャスティクス取引戦略

概要
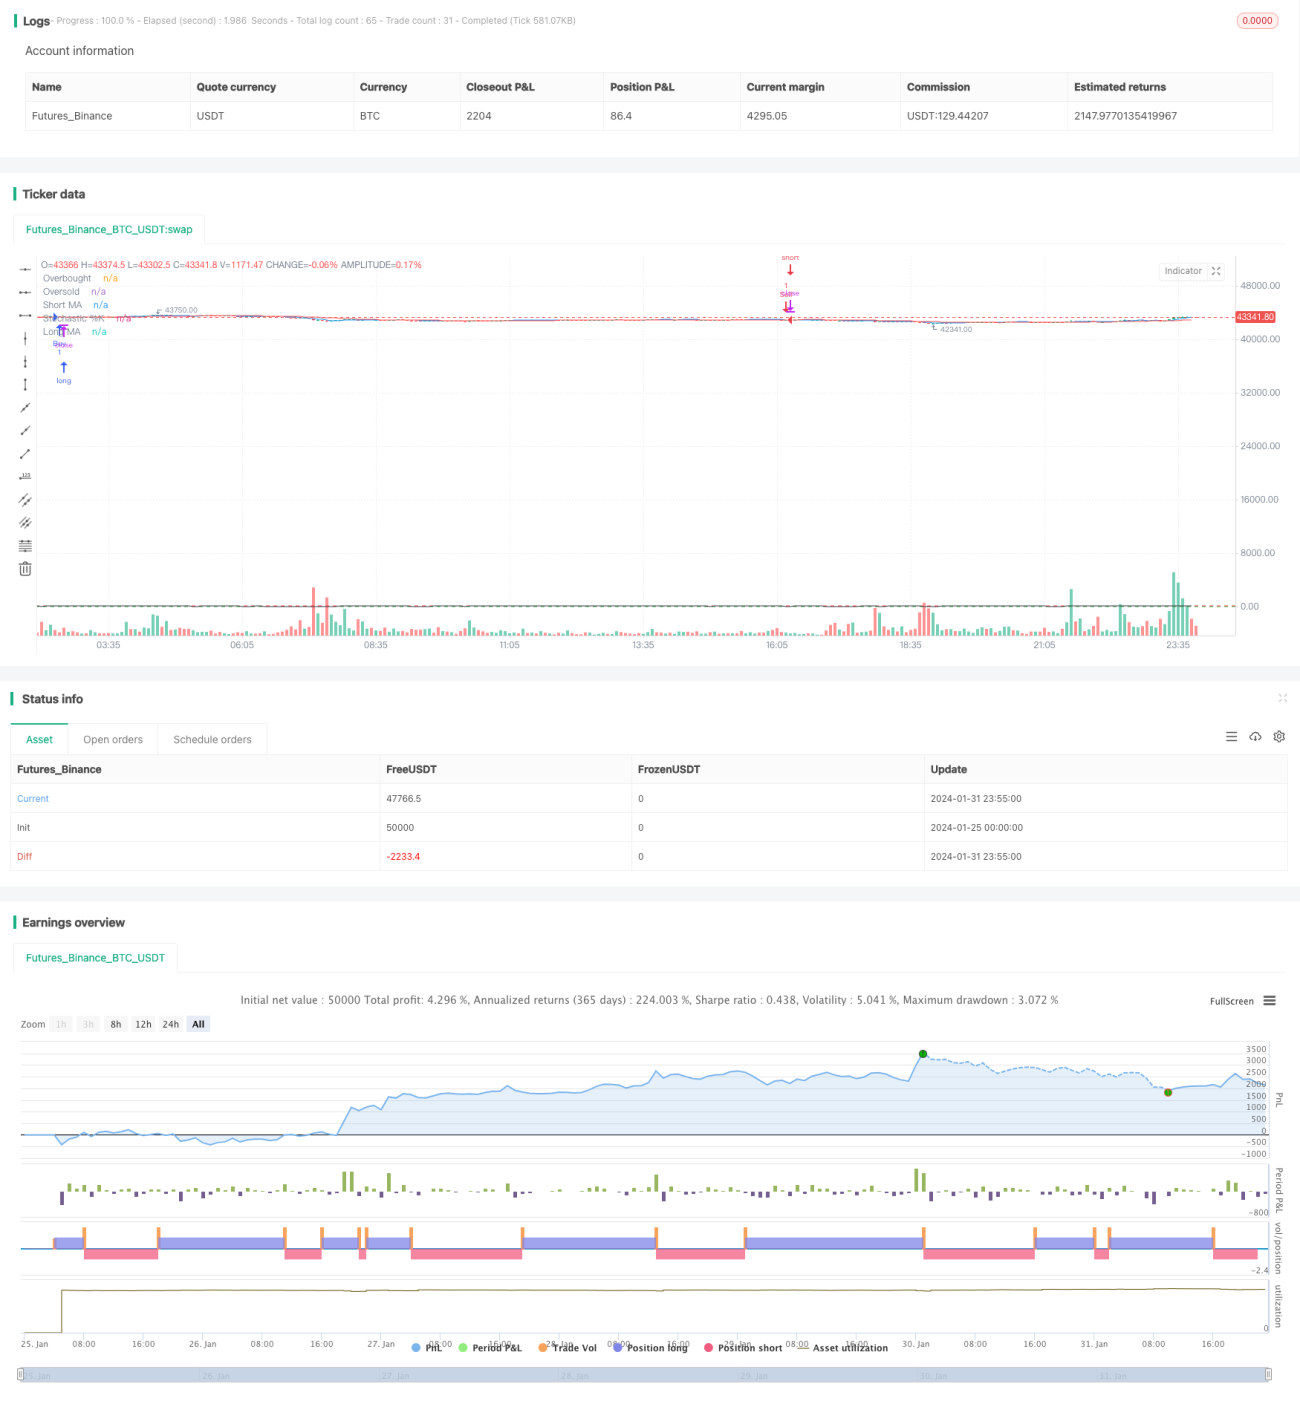
この戦略は,移動平均とランダムな指標を組み合わせて,自動化された株式取引システムを実現する.それは,2つの異なる長さの移動平均とランダムな指標を使用して,トレンドとオーバーバイのオーバーセールの信号を捕捉し,トレンドの方向とオーバーバイのオーバーセールの領域の指標信号に基づいて,買取りを行う.
戦略原則
1. 移動平均
快線 ((5日線) と慢線 ((20日線) の2つの移動平均を使用する. 快線上を慢線を横切るときは買入シグナル,下を横切るときは売出シグナルである. 移動平均の役割は価格の傾向と方向を判断することである.
2. ランダムな指標
ランダムな指標のパラメータ設定は:K線周期14,K線平滑周期3,D線平滑周期3。K線20以下は超売り地域,80以上は超売り地域。ランダムな指標の役割は,超買い超売り地域にあるかどうかを判断する。
3. 売買のルール
購入条件:快線で慢線とK線を貫く<20 (超売り地域)
販売条件:速線下穿越線 and K線>80 (超買区)
購入条件を満たすとき,買い物を多めにし,販売条件を満たすとき,空売りする.
4. ストップダメージ設定
購入後に1%のストップを設定し,売却後に1%のストップを設定します.
優位分析
この戦略は,トレンドと指標を組み合わせて,価格の中長線トレンドを効果的に捕捉し,同時に,ランダムな指標を使用して,買い買いのタイミングを制御し,明確な方向性がないときに任意の買い買い操作を避ける.戦略のパラメータは,空間を調整して,異なる市場環境に合わせて調整することができます.全体的に,この戦略は,大中盤全体的に上昇した株式に適用して効果が良い.
リスクと解決策
-
もし,特大ニュース面による激動的な状況に遭遇すると,大きな損失がもたらされる可能性があります. リスク管理のためにストップラインを設定できます.
-
横断整理が継続された場合,連続した小規模な損失がもたらされる可能性があります.移動平均の周期パラメータを適切に調整して損失を減らすことができます.
-
株価が急激に反転し,誤った取引が起こりやすいので,株価の急激な時期は避けるように注意する必要があります.
最適化の方向
-
異なるパラメータの組み合わせをテストし,最適なパラメータの組み合わせを探します.例えば,異なる長さの移動平均の組み合わせの効果をテストします.
-
取引量,変動率などの他の分析ツールと組み合わせて,フィルタリング条件を設定して,戦略の<unk>率を向上させることができます.
-
株の選択メカニズム,優遇株や加重指数などの選択を研究して,個々の株のリスクを低減することができる.
要約する
この戦略は,全体的に順調に動作し,ストップ・ストップ条件を設定した後に,全体的に利益と損失の結果が良好である.パラメータ調整と株式池の選択の最適化によって,効果をさらに高めることができる.全体的に,これは動作が安定し,実行が容易な量化取引戦略である.
- 1