ボルバンバンド + RSI + ADX + ATR 反転取引戦略
作成日:
2024-02-21 14:13:47
最終変更日:
2024-02-21 14:13:47
コピー:
2
クリック数:
1193
1
フォロー
1750
フォロワー
概要
この戦略は,複数の技術指標を融合し,ボルバン帯の指標が価格逆転信号を発したときに,RSI,ADX,ATRの指標と組み合わせて市場の構造を判断し,高い確率の逆転取引機会を探します.
戦略原則
20周期のボルバーバンドを使用し,価格が上下軌道に達する時に反転K線を構成する買入シグナルを待つ.
RSIは,市場が揺れ圏内にあるかどうかを判断する指標で,RSIは60以上は看板範囲で,40未満は看板範囲である.
ADXは20を下回ると,市場が揺れ動いていると判断し,20以上は市場が動いていると判断する.
ATRの止損設定と止損追跡
EMAの均線フィルター信号と組み合わせた.
戦略的優位分析
複数の指標が融合し,高確率の取引シグナルを形成する.
設定可能なパラメータ,異なる市場環境に適応する.
リスク管理の厳格なルール
戦略的リスク分析
パラメータを正しく設定しない場合,取引が頻発する可能性があります.
逆転が失敗する可能性は依然として存在します.
ストップ・ロスト・トラッキングは特定の市場では有効でない可能性があります.
戦略最適化の方向性
より多くの指標の組み合わせをテストし,より適切なパラメータ配置を探します.
突破の失敗の後,逆転の機会を早期に認識する.
テストした結果, 損失を減らし, 損失を減らし, 損失を減らし,
要約する
この戦略は,ボルバン帯を基本取引信号として使うと同時に,複数の補助指標が高確率のフィルタリングシステムを形成し,止損規則も比較的完備である.パラメータ調整と指標最適化によって戦略のパフォーマンスをさらに強化することができる.全体的に見ると,この戦略は,信頼性の高い反転取引システムを形成している.
ストラテジーソースコード
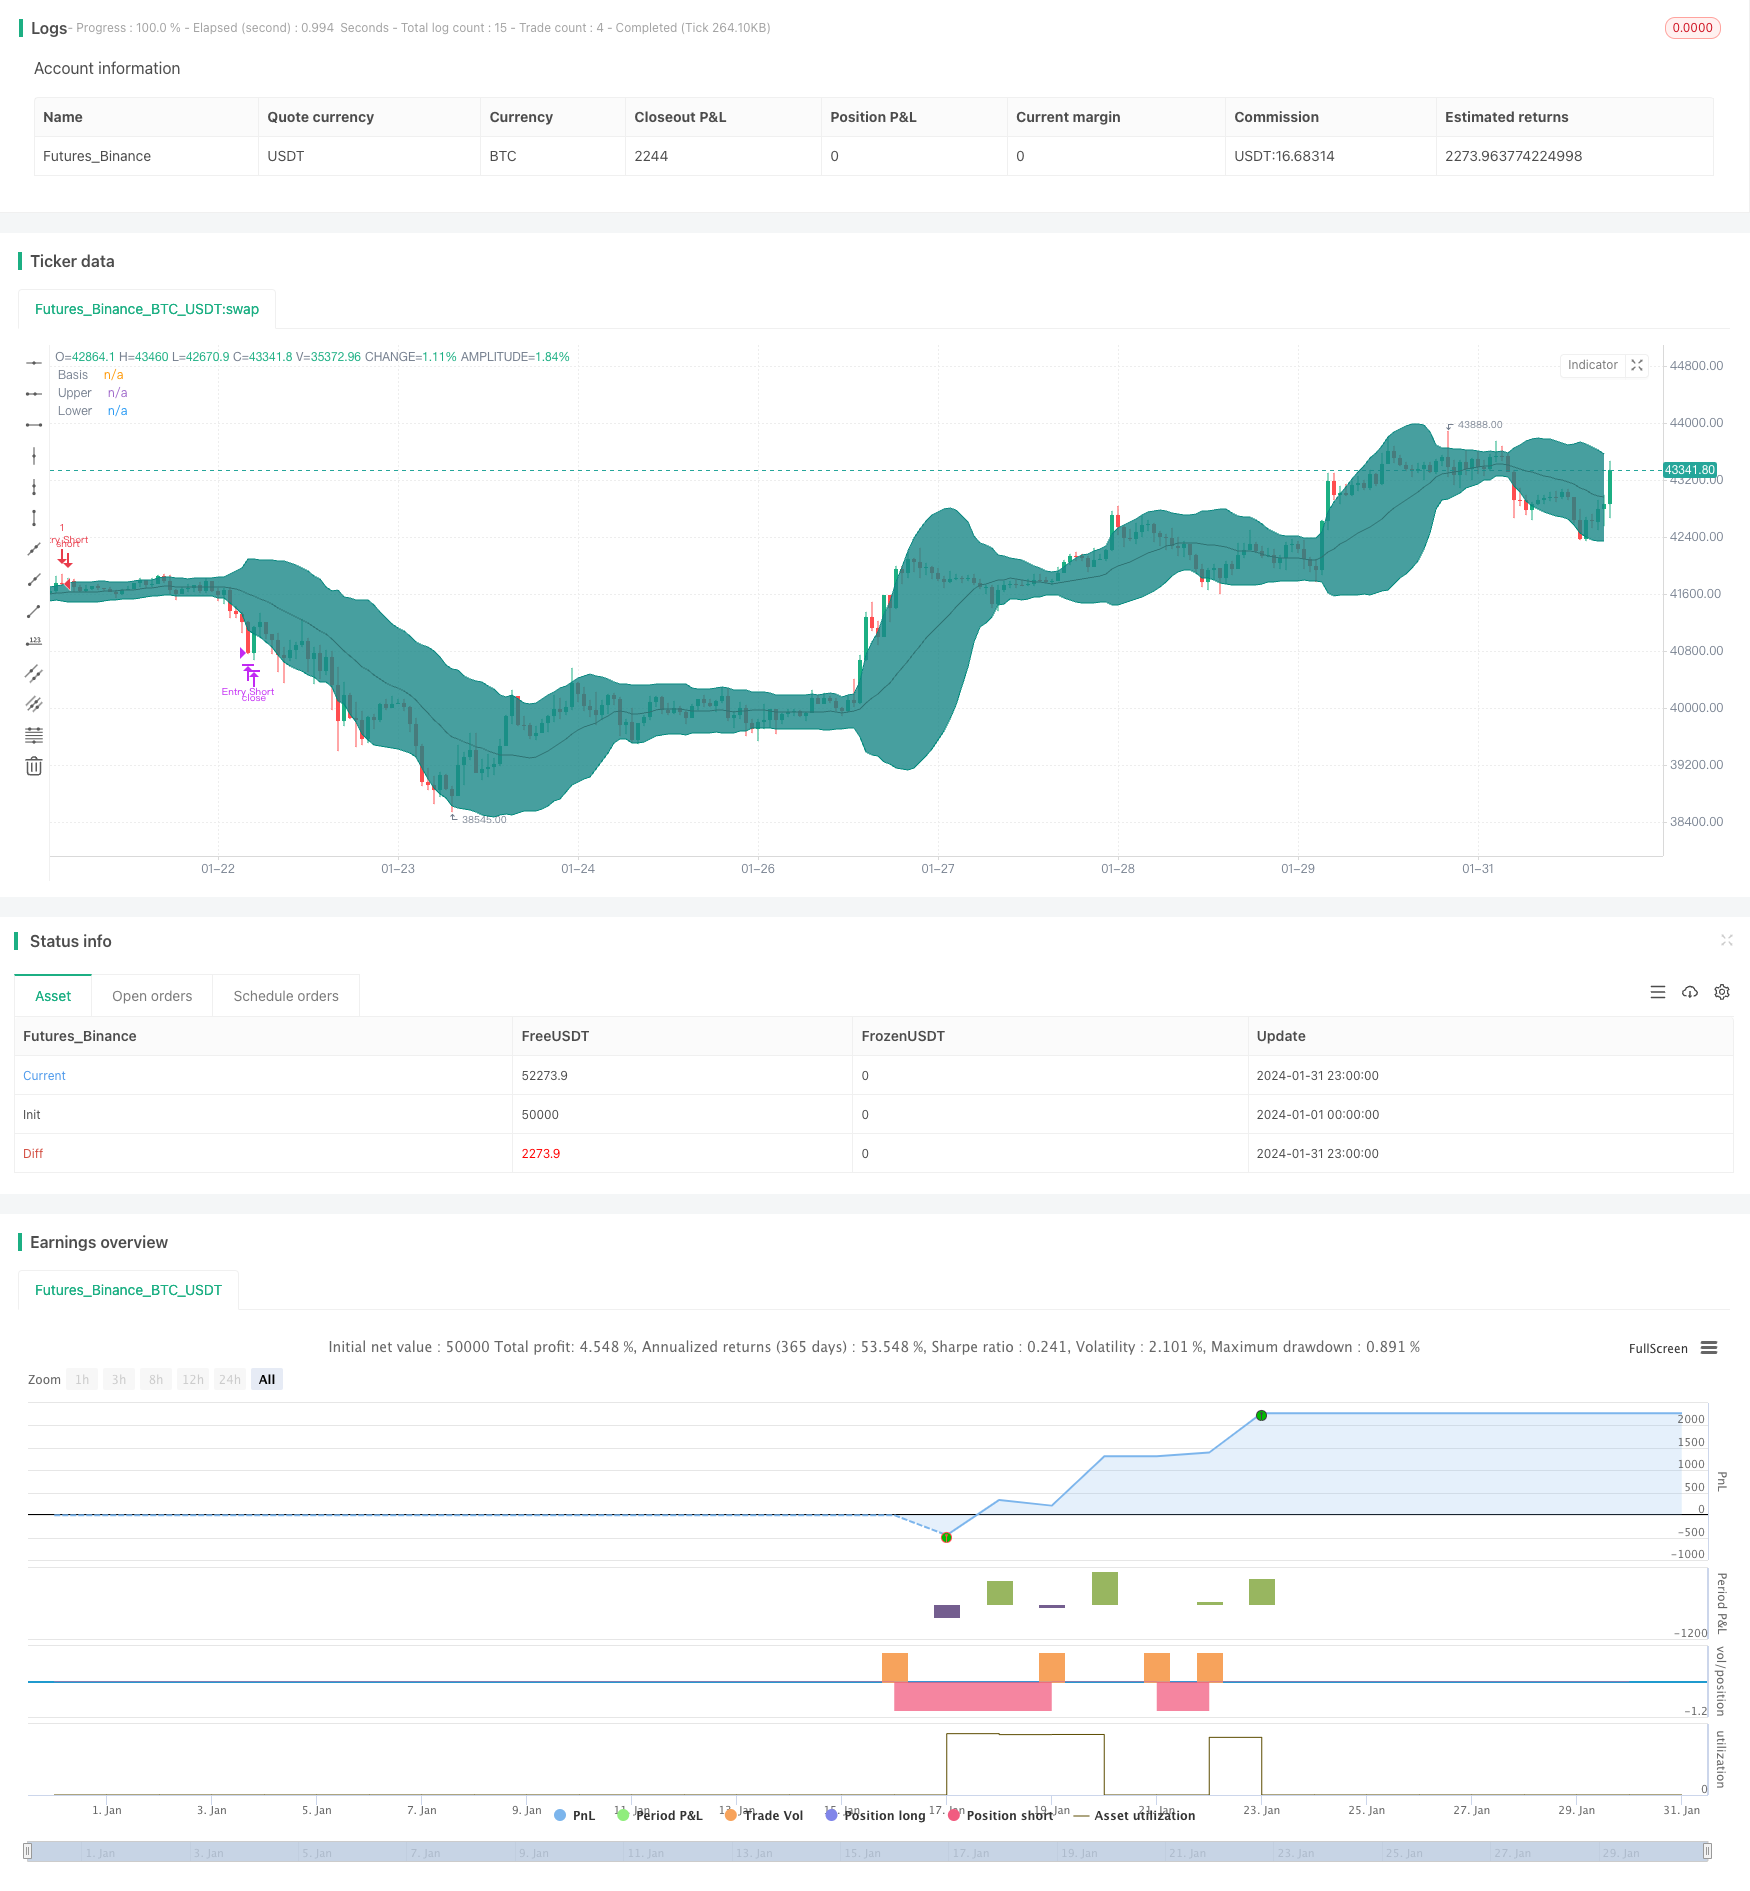
/*backtest
start: 2024-01-01 00:00:00
end: 2024-01-31 23:59:59
period: 1h
basePeriod: 15m
exchanges: [{"eid":"Futures_Binance","currency":"BTC_USDT"}]
*/

//@version=4
strategy(shorttitle="BB + EMA + RSI + ADX + ATR Reversal", title="Bollinger Bands Reversal", overlay=true)

// Inputs
ema1Input       = input(title = "EMA1 Input",                          defval = 200,   minval = 10,    maxval = 400,   step = 10,                      group = "Indicators")
ema2Input       = input(title = "EMA2 Input",                          defval = 100,   minval = 10,    maxval = 400,   step = 10,                      group = "Indicators")
length          = input(title = "BB Length",                           defval = 20,    minval=1,                                                       group = "Bollinger Band Indicator")
bbsrc           = input(title = "BB Source",                            defval = close,                                                                 group = "Bollinger Band Indicator")
mult            = input(title = "BB Standard Deviation",            type = input.float,     defval = 2.0,   minval=0.001,   maxval=50,                                      group = "Bollinger Band Indicator")
offset          = input(title = "BB Offset",                           defval = 0,     minval = -500,  maxval = 500,                                   group = "Bollinger Band Indicator")
rsilen          = input(title = "RSI Length",                          defval = 14,    minval=1,                                                       group = "RSI Indicator")
rsisrc          = input(title = "RSI Source",                           defval = close,                                                                 group = "RSI Indicator")
rsiMaxEntry     = input(title = "RSI Maximum Value",                   defval = 60,    minval = 50,    maxval = 100,                                   group = "RSI Indicator")
rsiMinEntry     = input(title = "RSI Minimum Value",                   defval = 40,    minval = 0,     maxval = 50,                                    group = "RSI Indicator")
rsiMaxExit      = input(title = "RSI Max Exit Value",                  defval = 70,    minval = 50,    maxval = 100,                                   group = "RSI Indicator")
rsiMinExit      = input(title = "RSI Min Exit Value",                  defval = 30,    minval = 0,     maxval = 50,                                    group = "RSI Indicator")
atrLength       = input(title = "ATR Length",                          defval = 14,    minval = 1,                                                     group = "ATR Indicator")
useStructure    = input(title = "Use Trailing Stop?",               type = input.bool,      defval = true,                                                                  group = "ATR Indicator")
atrlookback     = input(title = "ATR Lookback Period",                 defval = 7,     minval = 1,                                                     group = "ATR Indicator")
atrMultiplier   = input(title = "ATR Multiplier",                   type = input.float,     defval = 1.0,   minval = 0.1,                                                   group = "ATR Indicator")
sigMaxValue     = input(title = "ADX Max Value",                    type = input.float,     defval = 20.0,  minval = 0,     maxval = 100,   step = 0.1,                     group = "ADX Indicator")
adxlen          = input(title = "ADX Smoothing",                       defval = 14,                                                                    group = "ADX Indicator")
dilen           = input(title = "DI Length",                           defval = 14,                                                                    group = "ADX Indicator")

// Date input
fromMonth       = input(defval = 1,    title = "From Month",           minval = 1,     maxval = 12,    group = "Backtest Date Range")
fromDay         = input(defval = 1,    title = "From Day",             minval = 1,     maxval = 31,    group = "Backtest Date Range")
fromYear        = input(defval = 2000, title = "From Year",            minval = 1970,                  group = "Backtest Date Range")
thruMonth       = input(defval = 1,    title = "Thru Month",           minval = 1,     maxval = 12,    group = "Backtest Date Range")
thruDay         = input(defval = 1,    title = "Thru Day",             minval = 1,     maxval = 31,    group = "Backtest Date Range")
thruYear        = input(defval = 2099, title = "Thru Year",            minval = 1970,                  group = "Backtest Date Range")
inDataRange     = true

// Built in Bollinger Band
basis           = sma(bbsrc, length)
dev             = mult * stdev(bbsrc, length)
upper           = basis + dev
lower           = basis - dev
// Built in RSI
up              = rma(max(change(rsisrc), 0), rsilen)
down            = rma(-min(change(rsisrc), 0), rsilen)
rsi             = down == 0 ? 100 : up == 0 ? 0 : 100 - (100 / (1 + up / down))
// Built in ADX
dirmov(len) =>
	up = change(high)
	down = -change(low)
	plusDM = na(up) ? na : (up > down and up > 0 ? up : 0)
	minusDM = na(down) ? na : (down > up and down > 0 ? down : 0)
	truerange = rma(tr, len)
	plus = fixnan(100 * rma(plusDM, len) / truerange)
	minus = fixnan(100 * rma(minusDM, len) / truerange)
	[plus, minus]
adx(dilen, adxlen) =>
	[plus, minus] = dirmov(dilen)
	sum = plus + minus
	adx = 100 * rma(abs(plus - minus) / (sum == 0 ? 1 : sum), adxlen)
sig = adx(dilen, adxlen)

// Custom variables
ema1 = ema(close, ema1Input)
ema2 = ema(close, ema2Input)
atr = atr(atrLength)

// Entry and exit signals
CrossLongEntry  = (close <= lower or close[1] <= lower[1]) and close > open and close[1] < open[1] and close > ema1 and close > ema2 and strategy.position_size == 0 and inDataRange and rsi > rsiMinEntry and rsi < rsiMaxEntry and sig < sigMaxValue
CrossShortEntry = (close >= upper or close[1] >= upper[1]) and close < open and close[1] > open[1] and close < ema1 and close < ema2 and strategy.position_size == 0 and inDataRange and rsi > rsiMinEntry and rsi < rsiMaxEntry and sig < sigMaxValue

CrossLongExit   = (close >= upper or close[1] >= upper[1]) and close < open and close[1] > open[1] and strategy.position_size > 0 and inDataRange or rsi < rsiMinExit or rsi > rsiMaxExit
CrossShortExit  = (close <= lower or close[1] <= lower[1]) and close > open and close[1] < open[1] and strategy.position_size < 0 and inDataRange or rsi < rsiMinExit or rsi > rsiMaxExit

// Determining the stop loss based on ATR
StopLossLong    = (useStructure ? lowest(low, atrlookback) : close) - atr * atrMultiplier
StopLossShort   = (useStructure ? highest(high, atrlookback) : close) + atr * atrMultiplier

// Custom variables used to store the stoploss value
var StopLong    = 0.0
var StopShort   = 0.0
// Telling my script to store the stoploss value in the corresponding variables
if CrossLongEntry
    StopLong := StopLossLong
if CrossShortEntry
    StopShort := StopLossShort

// Strategy
strategy.entry("Entry Long", strategy.long, when = CrossLongEntry, comment = "Entry Long")
strategy.close("Entry Long", when = CrossLongExit or close < StopLong, comment = "Long Exit")

strategy.entry("Entry Short", strategy.short, when = CrossShortEntry, comment = "Entry Short")
strategy.close("Entry Short", when = CrossShortExit or close > StopShort, comment = "Short Exit")

// Plots the Bollinger Band
plot(basis, "Basis", color=#872323, offset = offset)
p1 = plot(upper, "Upper", color=color.teal, offset = offset)
p2 = plot(lower, "Lower", color=color.teal, offset = offset)
fill(p1, p2, title = "Background", color=#198787, transp=95)

// Use this if you want to see the stoploss visualised, be aware though plotting these can be confusing
// plot(StopLong)
// plot(StopShort)