歴史的トレンドの変異戦略
作成日:
2024-02-26 16:45:21
最終変更日:
2024-02-26 16:45:21
コピー:
0
クリック数:
755
1
フォロー
1750
フォロワー
概要
歴史的トレンド誘導戦略は,トレンドの逆転点を特定するために流指標を使用し,指数移動平均と組み合わせて取引シグナルを生成し,有利な動きを捕捉することを目的としています. この戦略は,流指標と移動平均の使用の優位性を巧妙に組み合わせて,市場動きを効果的に判断し,取引ガイドを提供することができます.
元の解釈
流動指数- 価格の正向運動と負向運動を分析してトレンドの方向と強さを判断する.主要パラメータには,周期長さ,倍数,値が含まれている.
指数移動平均線- 閉盤価格の指数平滑化により,より流暢なトレンド判断が提供されます.移動平均の周期が長くなるほど,トレンド判断はより安定します.
この戦略は,流指標を用いて市場の主要トレンドの方向を判断し,指標線が値を越えたときに取引信号を生成する.移動平均と組み合わせてフィルターを行い,誤った信号を避ける.具体的には,流指標が値線を上方を越えて移動平均より高い価格で買い信号を生成する.流指標が値線を下方を越えて移動平均より低い価格で売り信号を生成する.
優位分析
- 流指標の逆転認識能力を活用して,潜在的トレンド転換の機会をタイムリーに捉える
- 移動平均と組み合わせたシグナルフィルタリングにより,波動的な取引を避ける
- パラメータによる最適化,異なる市場環境に適用できる戦略の感度調整
- 直感的なインターフェースと明確な取引信号,リアルタイム操作に便利
リスク分析
- 突発的な出来事により指標が機能不全するシステムのリスクに警戒する
- 震災の際には誤信号が多く発生する可能性があります.
- パラメータの設定が不適切である場合, 過激的または保守的な結果にもなります.
- 単一損失をコントロールするために適切なストップと組み合わせる
リスクに対して,追加のフィルターを追加し,複数の指標判断と最適化パラメータ設定を組み合わせ,適切な止損を設定することで対応することができます.
最適化の方向
- 異なる移動平均のタイプを試して,最も適合する組み合わせを探します.
- 最適なリターンを得るために,流指数と移動平均のパラメータを調整する
- 複数の時間周期で戦略の安定性をテストする
- ブリンバンドなどの指標のフィルタリング信号を追加
- 特定の品種に対するパラメータの微調整
要約する
歴史的トレンド誘導策は,全体的に比較的安定しており,潜在的トレンドの逆転を捉えながら,ある種のフィルタリング能力を持っている.パラメータ最適化とリスク管理の補助によって,この戦略は,より優れた収益率を得ることを期待できる.トレーダーは,実物盤で模倣して全面的に検証することをお勧めし,この戦略に基づいて革新的な展開を試みることもできる.
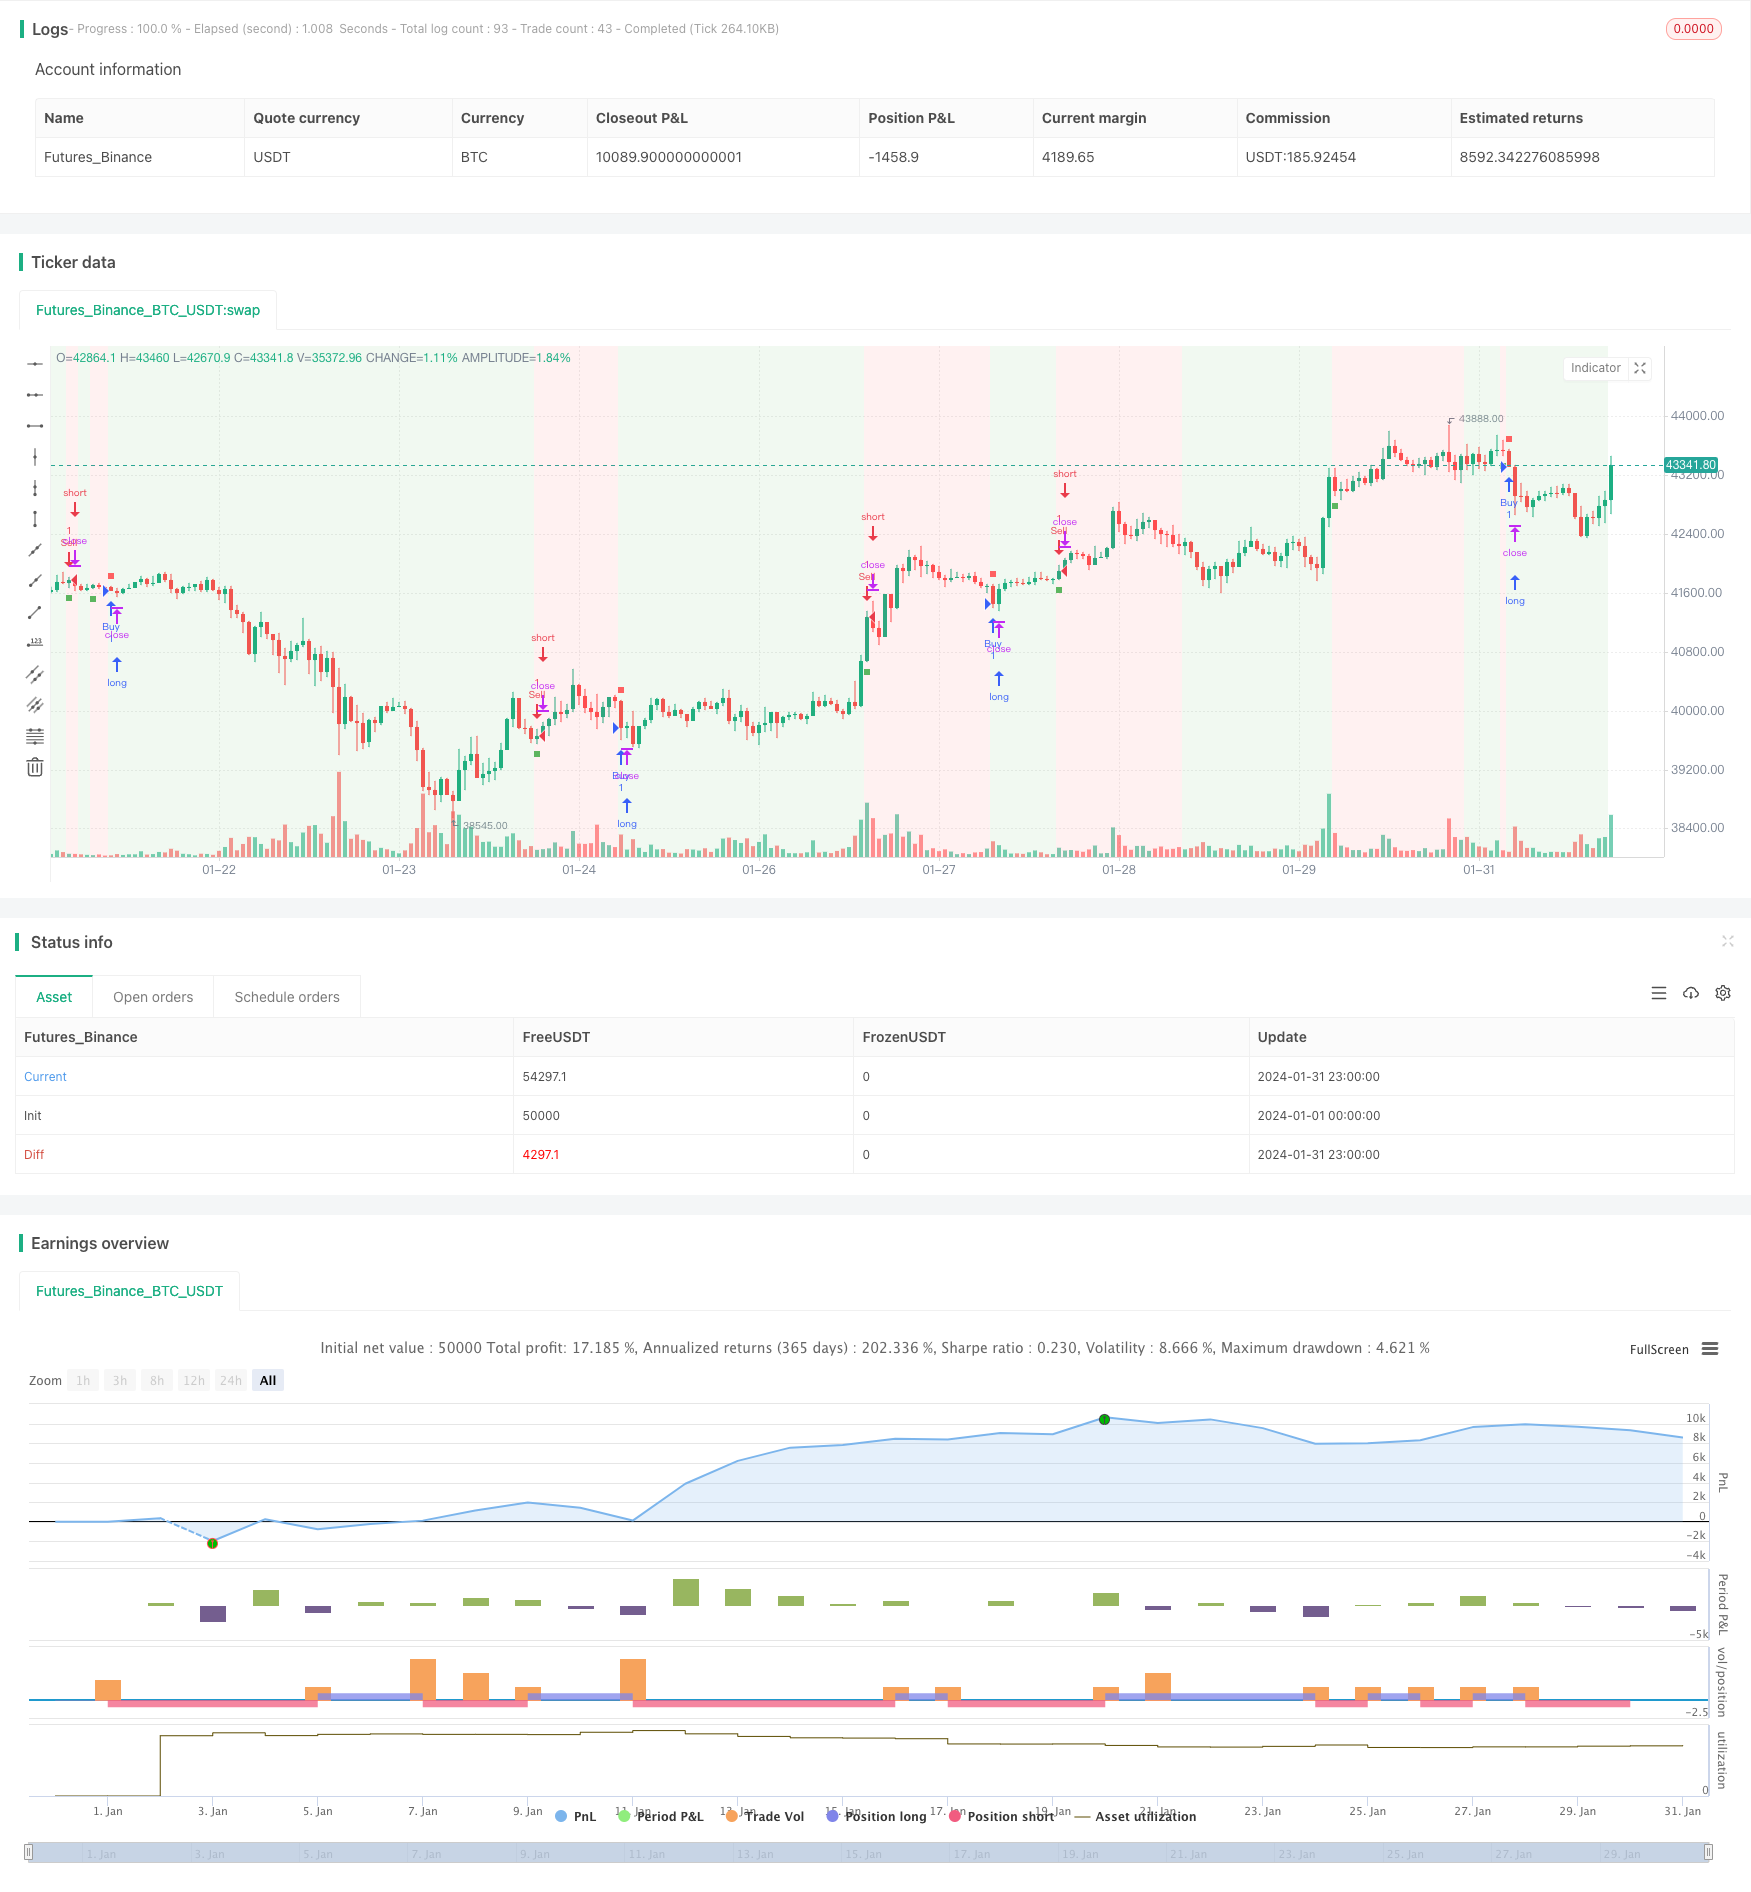
ストラテジーソースコード
/*backtest
start: 2024-01-01 00:00:00
end: 2024-01-31 23:59:59
period: 1h
basePeriod: 15m
exchanges: [{"eid":"Futures_Binance","currency":"BTC_USDT"}]
*/

// This work is licensed under a Attribution-NonCommercial-ShareAlike 4.0 International (CC BY-NC-SA 4.0) https://creativecommons.org/licenses/by-nc-sa/4.0/
// © AstroHub

//@version=5
strategy("Vortex Strategy [AstroHub]", shorttitle="VS [AstroHub]", overlay=true)

// Vortex Indicator Settings
length = input(14, title="Length", group ="AstroHub Vortex Strategy", tooltip="Number of bars used in the Vortex Indicator calculation. Higher values may result in smoother but slower responses to price changes.")
mult = input(1.0, title="Multiplier", group ="AstroHub Vortex Strategy", tooltip="Multiplier for the Vortex Indicator calculation. Adjust to fine-tune the sensitivity of the indicator to price movements.")
threshold = input(0.5, title="Threshold",group ="AstroHub Vortex Strategy",  tooltip="Threshold level for determining the trend. Higher values increase the likelihood of a trend change being identified.")
emaLength = input(20, title="EMA Length", group ="AstroHub Vortex Strategy", tooltip="Length of the Exponential Moving Average (EMA) used in the strategy. A longer EMA may provide a smoother trend indication.")

// Calculate Vortex Indicator components
a = math.abs(close - close[1])
b = close - ta.sma(close, length)
shl = ta.ema(b, length)
svl = ta.ema(a, length)

// Determine trend direction
upTrend = shl > svl
downTrend = shl < svl

// Define Buy and Sell signals
buySignal = ta.crossover(shl, svl) and close > ta.ema(close, emaLength) and (upTrend != upTrend[1])
sellSignal = ta.crossunder(shl, svl) and close < ta.ema(close, emaLength) and (downTrend != downTrend[1])

// Execute strategy based on signals
strategy.entry("Sell", strategy.short, when=buySignal)
strategy.entry("Buy", strategy.long, when=sellSignal)

// Background color based on the trend
bgcolor(downTrend ? color.new(color.green, 90) : upTrend ? color.new(color.red, 90) : na)

// Plot Buy and Sell signals with different shapes and colors
buySignal1 = ta.crossover(shl, svl) and close > ta.ema(close, emaLength)
sellSignal1 = ta.crossunder(shl, svl) and close < ta.ema(close, emaLength)

plotshape(buySignal1, style=shape.square, color=color.new(color.green, 10), size=size.tiny, location=location.belowbar, title="Buy Signal")
plotshape(sellSignal1, style=shape.square, color=color.new(color.red, 10), size=size.tiny, location=location.abovebar, title="Sell Signal")
plotshape(buySignal1, style=shape.square, color=color.new(color.green, 90), size=size.small, location=location.belowbar, title="Buy Signal")
plotshape(sellSignal1, style=shape.square, color=color.new(color.red, 90), size=size.small, location=location.abovebar, title="Sell Signal")