年内調整に基づくRSIスイングトレード戦略


作成日: 2024-02-29 10:54:45 最終変更日: 2024-02-29 10:54:45
コピー: 0 クリック数: 592
1
フォロー
1617
フォロワー

年内調整に基づくRSIスイングトレード戦略

概要

この戦略は,年中調整に基づくRSI振動取引戦略であり,RSI指標が設定された上下軌道間の振動特性を追跡し,RSI指標が上下軌道に触れたときに取引信号を発信します.

戦略原則

  1. 平均線長,RSIパラメータ,上下トレイル,ストップ・ロストパラメータ,取引周期の範囲を設定します.
  2. RSIを計算すると,RSI= (平均上昇) / (平均上昇 + 平均下落)*100
  3. RSI指標と上下トレイルを描画する
  4. RSIの上は多信号で下は空信号
  5. OCOのリストを作成
  6. 設定したストップ・ストップ・ロジックに従ってストップ・ストップ・ストップ

戦略的優位分析

  1. 年間取引サイクルを設定することで,不適切な外部環境を回避できます.
  2. RSI指標は,過剰買いと過剰売りを効果的に反映し,合理的な区間を設定して震動取引を行うことで,一部のノイズをフィルターすることができます.
  3. OCOは,ストップ・ストップ・ロスの設定と組み合わせて,効率的なリスク管理を実現します.

戦略的リスク分析

  1. RSIの批判的判断の正確さは保証できないので,ある程度の誤判のリスクがあるかもしれない.
  2. 年間取引サイクルを誤って設定すると,より良い取引機会を逃したり,不適切な取引環境に入ることもあります.
  3. ストップポイントが大きすぎると大きな損失が起こり,ストップポイントが小さすぎると利益が小さすぎます.

RSIパラメータ,取引サイクル時間帯,ストップ・ストップ・損失比率などの方法で最適化できます.

戦略最適化の方向性

  1. RSIパラメータの最適値を異なる市場で異なる周期でテスト
  2. 市場全体の周期的法則を分析し,年間における最適の取引時期を設定する.
  3. 合理的なストップ・ロスの比率を反測で決定する
  4. 取引品種選択の最適化と保有量の拡大
  5. 他の優れた取引手法や指標と組み合わせた最適化

要約する

この戦略は,RSI指標が1年以内に指定された周期の震動特性を利用してトレンドを追跡し,取引リスクを効果的に制御します.パラメータの最適化とルール最適化により,より高い戦略効果を得ることができます.

ストラテジーソースコード
/*backtest
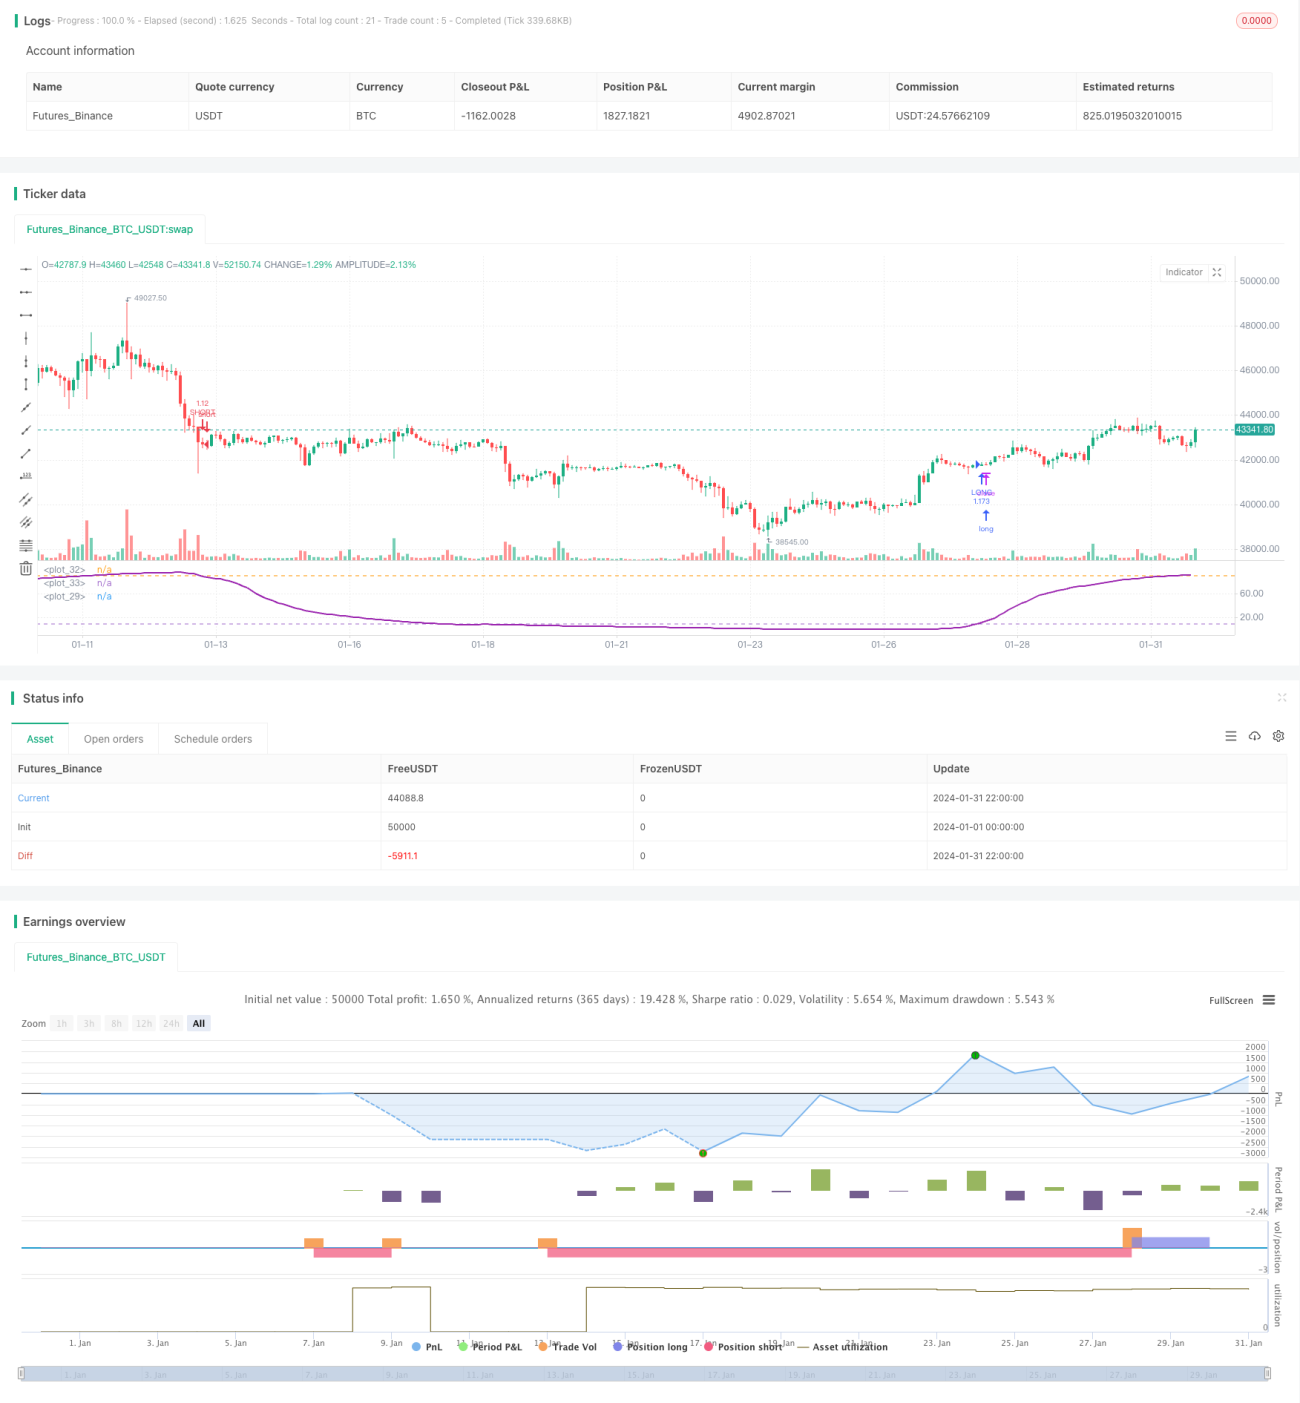
start: 2024-01-01 00:00:00
end: 2024-01-31 23:59:59
period: 2h
basePeriod: 15m
exchanges: [{"eid":"Futures_Binance","currency":"BTC_USDT"}]
*/

//@version=3
strategy(title = "Bitlinc MARSI Study AST",shorttitle="Bitlinc MARSI Study AST",default_qty_type = strategy.percent_of_equity, default_qty_value = 100,commission_type=strategy.commission.percent,commission_value=0.1,initial_capital=1000,currency="USD",pyramiding=0, calc_on_order_fills=false)

// === General Inputs ===
lengthofma = input(62, minval=1, title="Length of MA")
len = input(31, minval=1, title="Length")
upperband = input(89, minval=1, title='Upper Band for RSI')
lowerband = input(10, minval=1, title="Lower Band for RSI")
takeprofit =input(1.25, title="Take Profit Percent")
stoploss =input(.04, title ="Stop Loss Percent")
monthfrom =input(8, title = "Month Start")
monthuntil =input(12, title = "Month End")
dayfrom=input(1, title= "Day Start")
dayuntil=input(31, title= "Day End")

// === Innput Backtest Range ===
//FromMonth = input(defval = 9, title = "From Month", minval = 1, maxval = 12)
//FromDay   = input(defval = 1, title = "From Day", minval = 1, maxval = 31)
//FromYear  = input(defval = 2018, title = "From Year", minval = 2017)
//ToMonth   = input(defval = 1, title = "To Month", minval = 1, maxval = 12)
//ToDay     = input(defval = 1, title = "To Day", minval = 1, maxval = 31)
//ToYear    = input(defval = 9999, title = "To Year", minval = 2017)

// === Create RSI ===
src=sma(close,lengthofma)
up = rma(max(change(src), 0), len)
down = rma(-min(change(src), 0), len)
rsi = down == 0 ? 100 : up == 0 ? 0 : 100 - (100 / (1 + up / down))
plot(rsi,linewidth = 2, color=purple)

// === Plot Bands ===
band1 = hline(upperband)
band0 = hline(lowerband)
fill(band1, band0, color=blue, transp=95)

// === Entry and Exit Methods ===
longCond =  crossover(rsi,lowerband)
shortCond =  crossunder(rsi,upperband)

// === Long Entry Logic ===
if (  longCond ) 
    strategy.entry("LONG", strategy.long, stop=close, oca_name="TREND", comment="LONG")
else
    strategy.cancel(id="LONG")

// === Short Entry Logic ===    
if ( shortCond   ) 
    strategy.entry("SHORT", strategy.short,stop=close, oca_name="TREND",  comment="SHORT")
else
    strategy.cancel(id="SHORT")

// === Take Profit and Stop Loss Logic ===
//strategy.exit("Take Profit LONG", "LONG", profit = close * takeprofit / syminfo.mintick, loss = close * stoploss / syminfo.mintick)
//strategy.exit("Take Profit SHORT", "SHORT", profit = close * takeprofit / syminfo.mintick, loss = close * stoploss / syminfo.mintick)
strategy.exit("LONG TAKE PROFIT", "LONG", profit = close * takeprofit / syminfo.mintick)
strategy.exit("SHORT STOP LOSS", "SHORT", profit = close * takeprofit / syminfo.mintick)
strategy.exit("LONG STOP LOSS", "LONG", loss = close * stoploss / syminfo.mintick)
strategy.exit("SHORT STOP LOSS", "SHORT", loss = close * stoploss / syminfo.mintick)