ダイナミックエングルフィングトレンド戦略に基づく
作成日:
2024-02-29 11:24:18
最終変更日:
2024-02-29 11:24:18
コピー:
1
クリック数:
659
1
フォロー
1750
フォロワー
概要
動的吞食トレンド戦略は,吞食形態に基づいてトレンドの方向で取引する戦略である.この戦略は,平均実際の波動範囲 ((ATR)) を使って市場の変動性を認識し,スーパートレンド指標は市場のトレンドの方向を判断し,吞食形態に適合し,トレンドの方向に一致するときに多空操作を行う.止損位と止境位も,吞食形態の動態に基づいて計算される.
戦略原則
- ATRは市場波動率を測るものです.
- 超トレンド指標を計算し,市場の主要トレンド方向を判断する.
- 多頭市場と空頭市場の条件を定義する.
- トレンド方向に適合する多頭吞食 (上向き) と空頭吞食 (下向き) の形状を識別する.
- ストップ・ロースとストップ・ポジションは,スロープ形式によって計算されます.
- トレンドの方向に合致する吞食形態を認識すると,多量または空白操作を行う.
- 価格がストップ・ロースまたはストップ・ポジションに触れたとき,平仓する.
- グラフで吞食形態を識別する.
戦略的優位分析
この戦略の利点は以下の通りです.
- トレンド認識とトレンド認識を組み合わせて,信号の質を向上させる.
- ターニングポイントを特定し,ターゲットを設定する.
- 余空信号はより明確で,操作のタイミングを把握しやすい.
- ストップ・ローズ戦略は,トレンドに沿ってリスクをコントロールする戦略です.
- コードフレームワークは明確で,最適化や改善が容易です.
戦略的リスク分析
この戦略にはいくつかのリスクがあります.
- 誤認された破綻は損失を招く.
- グラフの形状のパラメータ,例えば体積,時間,など,把握するのが難しい.
- トレンド判断の仕組みが不完全で,トレンドに合わない操作につながる可能性がある.
- ストップ・ローズとストップ・ストップの設定は経験に依存し,主観的すぎるかもしれない.
- 効果はパラメータによる最適化であり,大量の歴史データによる検証が必要である.
上記のリスクは,以下の方法で制御および改善できます.
- 偽突破信号をフィルタリングする他の技術指標と組み合わせる.
- ATRを自律的に調整するなど,より安定したパラメータ計算方法を使用する.
- 機械学習モデルの導入など,トレンド判断メカニズムの信頼性を高めること.
- 遺伝的アルゴリズムなどの手段を用いて最適なパラメータの組み合わせを探します.
- より長い時間ウィンドウで反省し,パラメータの安定性を確保します.
戦略最適化の方向性
この戦略は最適化できる余地があります.
- 機械学習モデルを導入することで,トレンド判断の精度が向上します.
- 新しい形状認識方法と組み合わせた食物の形状認識の効果を改良した.
- 最新のストップ・ストップ・ストップ・ストラスト戦略を利用してストップ・ストラストポイントを動的に最適化します.
- 高周波データに基づいて,短線操作に適した吞食突破戦略を開発することができる.
- 異なる品種にパラメータ調整および最適化に使用できます.
要約する
全体的に見ると,動的吞食トレンド戦略は,効果が顕著な吞食形態と精密なトレンド判断を組み合わせて,入場信号精度,止損止損合理的な取引戦略を形成する.適用過程で,パラメータ最適化,リスク管理および新しい技術の導入によって戦略の安定性および収益性をさらに強化することができる.この戦略の枠組みは明確で,強力な汎用性があり,研究と応用を深めるに値する.
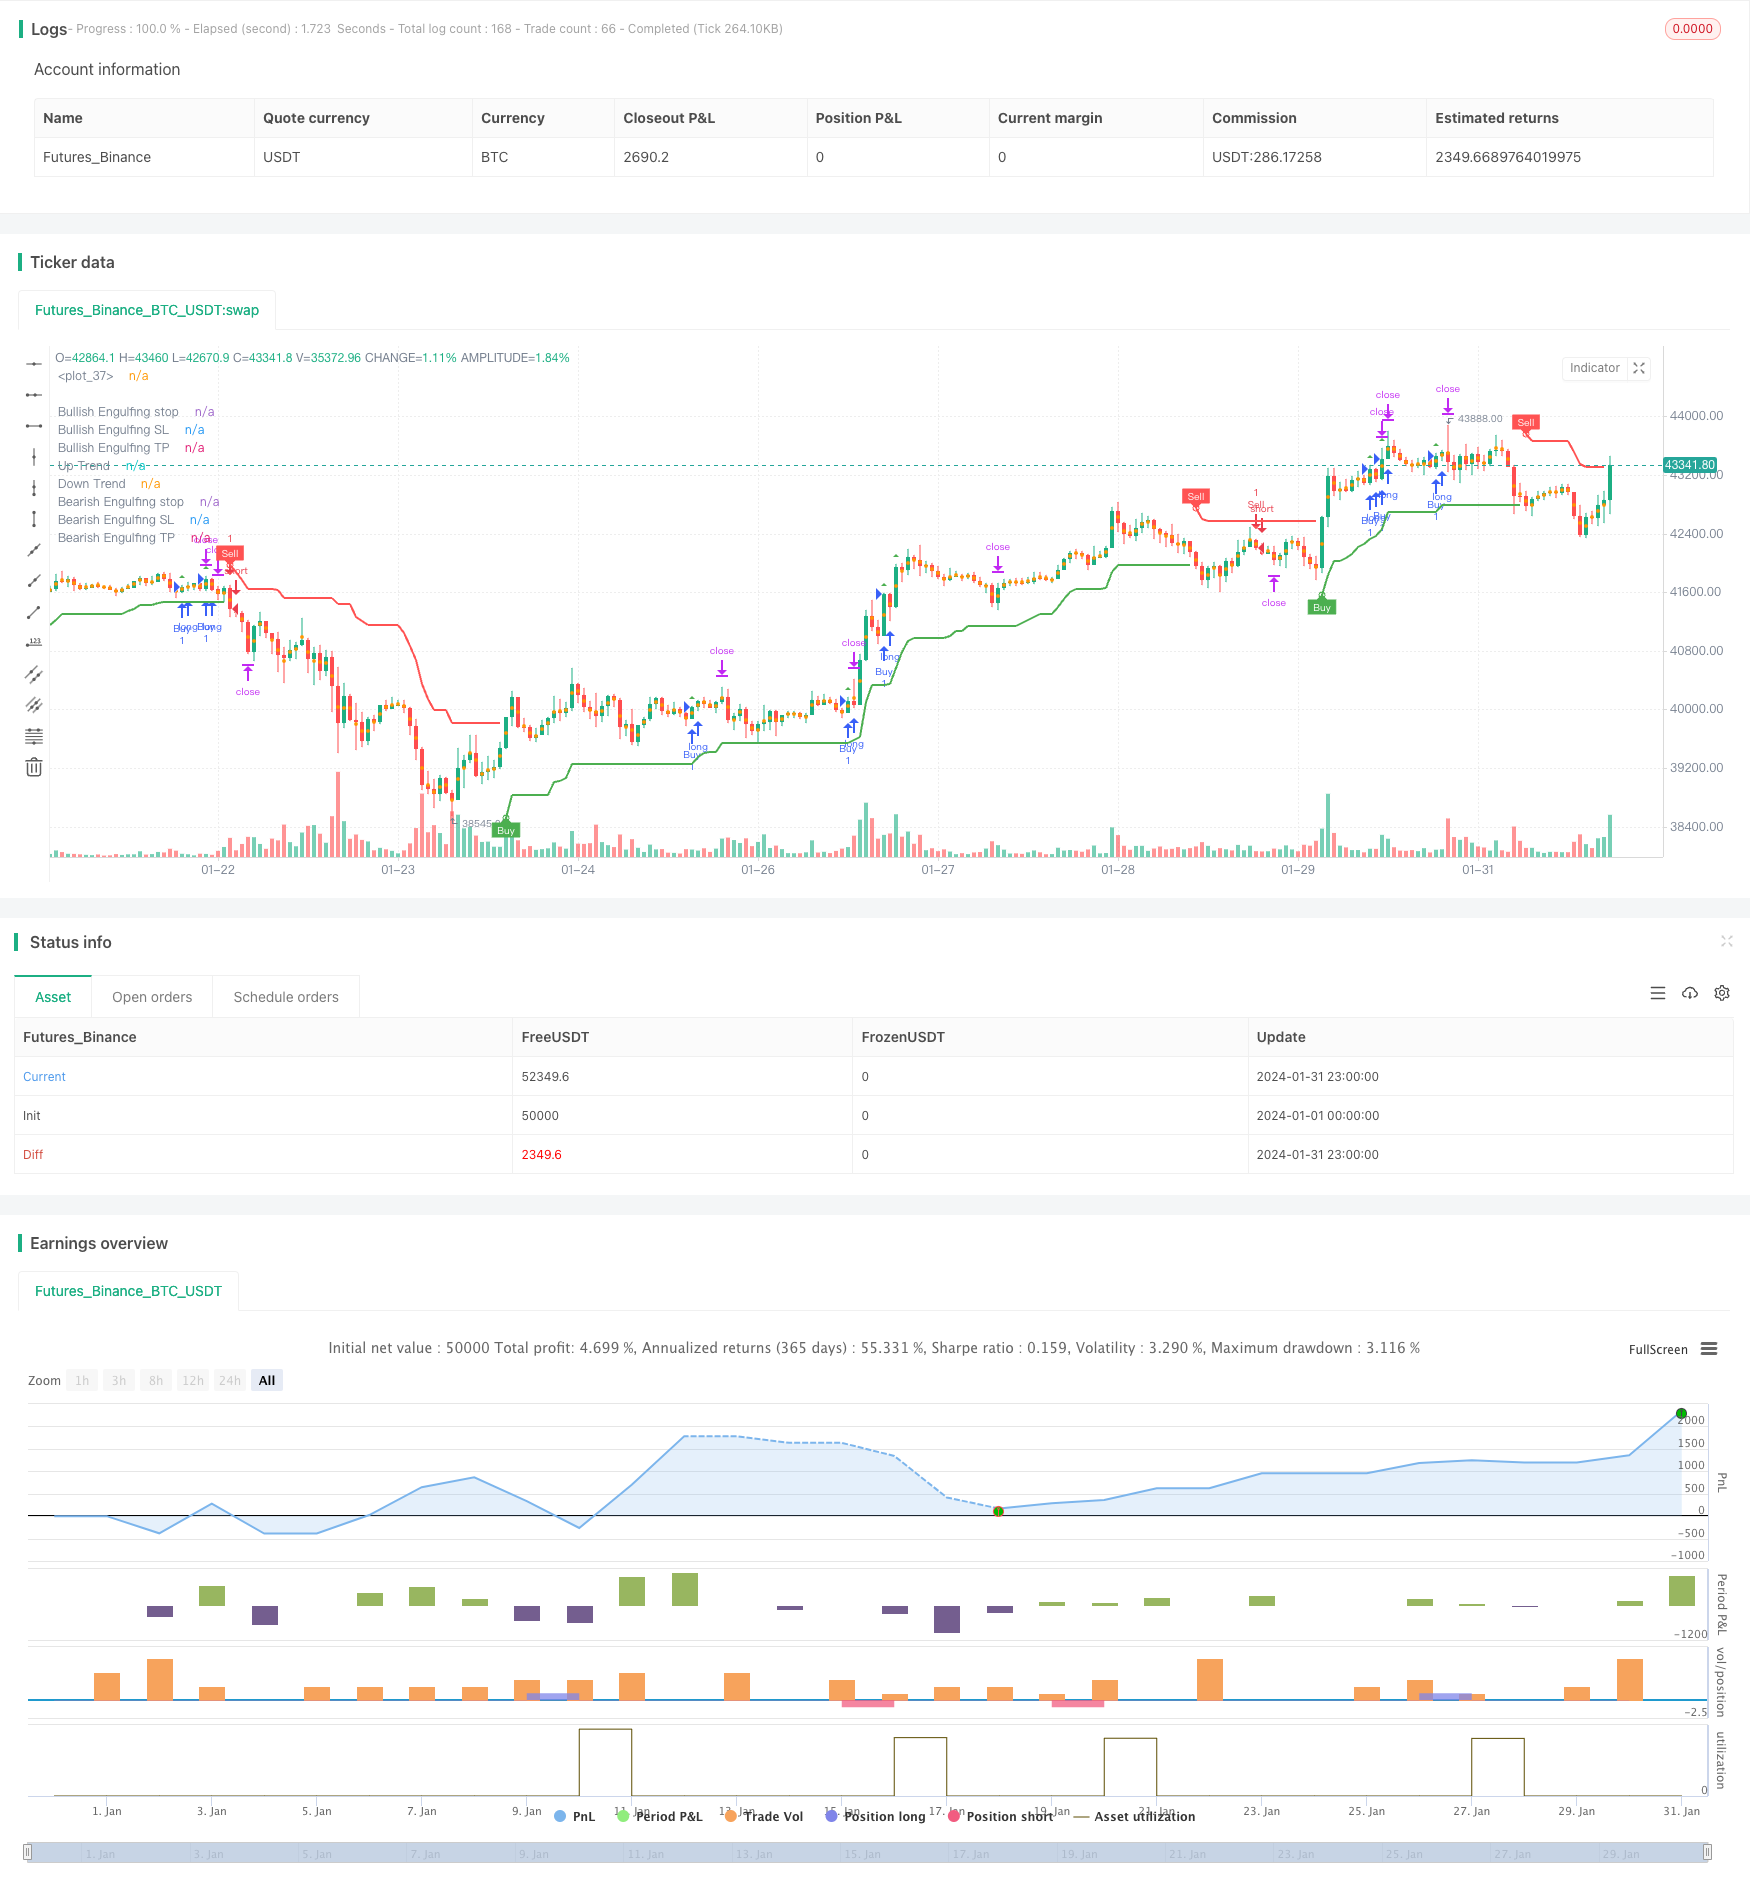
ストラテジーソースコード
/*backtest
start: 2024-01-01 00:00:00
end: 2024-01-31 23:59:59
period: 1h
basePeriod: 15m
exchanges: [{"eid":"Futures_Binance","currency":"BTC_USDT"}]
*/

// This source code is subject to the terms of the Mozilla Public License 2.0 at https://mozilla.org/MPL/2.0/
// © Malikdrajat


//@version=4
strategy("Engulfing with Trend", overlay=true)

Periods = input(title="ATR Period", type=input.integer, defval=10)
src = input(hl2, title="Source")
Multiplier = input(title="ATR Multiplier", type=input.float, step=0.1, defval=3.0)
changeATR= input(title="Change ATR Calculation Method ?", type=input.bool, defval=true)
showsignals = input(title="Show Buy/Sell Signals ?", type=input.bool, defval=true)
highlighting = input(title="Highlighter On/Off ?", type=input.bool, defval=true)

atr2 = sma(tr, Periods)
atr= changeATR ? atr(Periods) : atr2

up=src-(Multiplier*atr)
up1 = nz(up[1],up)
up := close[1] > up1 ? max(up,up1) : up
dn=src+(Multiplier*atr)
dn1 = nz(dn[1], dn)
dn := close[1] < dn1 ? min(dn, dn1) : dn

trend = 1
trend := nz(trend[1], trend)
trend := trend == -1 and close > dn1 ? 1 : trend == 1 and close < up1 ? -1 : trend

upPlot = plot(trend == 1 ? up : na, title="Up Trend", style=plot.style_linebr, linewidth=2, color=color.green)
buySignal = trend == 1 and trend[1] == -1
plotshape(buySignal ? up : na, title="UpTrend Begins", location=location.absolute, style=shape.circle, size=size.tiny, color=color.green, transp=0)
plotshape(buySignal and showsignals ? up : na, title="Buy", text="Buy", location=location.absolute, style=shape.labelup, size=size.tiny, color=color.green, textcolor=color.white, transp=0)
dnPlot = plot(trend == 1 ? na : dn, title="Down Trend", style=plot.style_linebr, linewidth=2, color=color.red)
sellSignal = trend == -1 and trend[1] == 1
plotshape(sellSignal ? dn : na, title="DownTrend Begins", location=location.absolute, style=shape.circle, size=size.tiny, color=color.red, transp=0)
plotshape(sellSignal and showsignals ? dn : na, title="Sell", text="Sell", location=location.absolute, style=shape.labeldown, size=size.tiny, color=color.red, textcolor=color.white, transp=0)
mPlot = plot(ohlc4, title="", style=plot.style_circles, linewidth=0)
longFillColor = highlighting ? (trend == 1 ? color.green : color.white) : color.white
shortFillColor = highlighting ? (trend == -1 ? color.red : color.white) : color.white
fill(mPlot, upPlot, title="UpTrend Highligter", color=longFillColor)
fill(mPlot, dnPlot, title="DownTrend Highligter", color=shortFillColor)
alertcondition(buySignal, title="SuperTrend Buy", message="SuperTrend Buy!")
alertcondition(sellSignal, title="SuperTrend Sell", message="SuperTrend Sell!")
changeCond = trend != trend[1]
alertcondition(changeCond, title="SuperTrend Direction Change", message="SuperTrend has changed direction!")

// Define Downtrend and Uptrend conditions
downtrend = trend == -1
uptrend = trend == 1


// Engulfing
boringThreshold = input(25, title="Boring Candle Threshold (%)", minval=1, maxval=100, step=1)
engulfingThreshold = input(50, title="Engulfing Candle Threshold (%)", minval=1, maxval=100, step=1)
stopLevel = input(200, title="Stop Level (Pips)", minval=1)


// Boring Candle (Inside Bar) and Engulfing Candlestick Conditions
isBoringCandle = abs(open[1] - close[1]) * 100 / abs(high[1] - low[1]) <= boringThreshold
isEngulfingCandle = abs(open - close) * 100 / abs(high - low) <= engulfingThreshold

// Bullish and Bearish Engulfing Conditions
bullEngulfing = uptrend and close[1] < open[1] and close > open[1] and not isBoringCandle and not isEngulfingCandle
bearEngulfing = downtrend and close[1] > open[1] and close < open[1] and not isBoringCandle and not isEngulfingCandle

// Stop Loss, Take Profit, and Entry Price Calculation
bullStop = close + (stopLevel * syminfo.mintick)
bearStop = close - (stopLevel * syminfo.mintick)
bullSL = low
bearSL = high
bullTP = bullStop + (bullStop - low)
bearTP = bearStop - (high - bearStop)

// Entry Conditions
enterLong = bullEngulfing and uptrend
enterShort = bearEngulfing and downtrend

// Exit Conditions
exitLong = crossover(close, bullTP) or crossover(close, bullSL)
exitShort = crossover(close, bearTP) or crossover(close, bearSL)

// Check if exit conditions are met by the next candle
exitLongNextCandle = exitLong and (crossover(close[1], bullTP[1]) or crossover(close[1], bullSL[1]))
exitShortNextCandle = exitShort and (crossover(close[1], bearTP[1]) or crossover(close[1], bearSL[1]))

// Strategy Execution
strategy.entry("Buy", strategy.long, when=enterLong )
strategy.entry("Sell", strategy.short, when=enterShort )

// Exit Conditions for Long (Buy) Positions
if (bullEngulfing and not na(bullTP) and not na(bullSL))
    strategy.exit("Exit Long", from_entry="Buy", stop=bullSL, limit=bullTP)

// Exit Conditions for Short (Sell) Positions
if (bearEngulfing and not na(bearTP) and not na(bearSL))
    strategy.exit("Exit Short", from_entry="Sell", stop=bearSL, limit=bearTP)

// Plot Shapes and Labels
plotshape(bullEngulfing, style=shape.triangleup, location=location.abovebar, color=color.green)
plotshape(bearEngulfing, style=shape.triangledown, location=location.abovebar, color=color.red)

// Determine OP, SL, and TP
plot(bullEngulfing ? bullStop : na, title="Bullish Engulfing stop", color=color.red, linewidth=3, style=plot.style_linebr)
plot(bearEngulfing ? bearStop : na, title="Bearish Engulfing stop", color=color.red, linewidth=3, style=plot.style_linebr)
plot(bullEngulfing ? bullSL : na, title="Bullish Engulfing SL", color=color.red, linewidth=3, style=plot.style_linebr)
plot(bearEngulfing ? bearSL : na, title="Bearish Engulfing SL", color=color.red, linewidth=3, style=plot.style_linebr)
plot(bullEngulfing ? bullTP : na, title="Bullish Engulfing TP", color=color.green, linewidth=3, style=plot.style_linebr)
plot(bearEngulfing ? bearTP : na, title="Bearish Engulfing TP", color=color.green, linewidth=3, style=plot.style_linebr)