VWAPとOBV RSI指標に基づくBabyShark取引戦略
戦略概要
BabyShark VWAP取引戦略は,取引量重み平均価格 ((VWAP) とエネルギー潮指標の相対的に弱い指数 ((OBV RSI) に基づく量的な取引戦略である. この戦略は,価格がVWAPからどのくらい偏っているか,OBV RSIが特定の値を破ったかに基づいて潜在的な買入と売却の信号を識別することを目的としている.
戦略原則
この戦略の核心原則は,VWAPとOBV RSIの2つの指標を使用して,市場の傾向と動力の変化を捉えることです.VWAPは,価格と取引量に基づいた動的平均線であり,市場の主要取引領域を反映します.価格がVWAPから著しく偏差すると,通常,市場が過買または過売れることを意味します.OBV RSIは,従来のRSI指標に基づいて取引量の要因を導入し,取引量の変化の強さを測定することによって市場のトレンドの健全性を判断します.
具体的には,この戦略は60K線をVWAPの計算周期として使用し,閉盘価格を入力データとして使用する.その後,価格がVWAPから正負3標準差の範囲で超買と超売区画を構成する.OBV RSIの場合,5K線を計算周期として使用し,70と30の2つの値を超買と超売の判断基準として設定する.
取引の論理では,価格がVWAPの下線の超売区にあり,OBV RSIが30以下であるとき,戦略は多信号を発信する.価格がVWAP上線の超買区にあり,OBV RSIが70以上であるとき,戦略は空信号を発信する.同時に,戦略は0.6%のストップ・ストップ・損失率を設定し,連続的な損失の後,10根K線の冷静期を導入してリスクを制御する.
戦略的優位性
- 価格と取引量などの複数の市場要素を組み合わせ,市場動向と動力を全面的に捉えます.
- ダイナミックなVWAPとOBV RSIの指標を使用し,異なる市場サイクルの変化に適応できます.
- 合理的なストップ・ストラスト比率と冷静期を設定し,チャンスを掴むと同時にリスクを効果的にコントロールする.
- 論理が明確で,理解し,実行しやすく,ある程度の解釈性がある.
- パラメータは調整可能で,異なるスタイルのトレーダーに最適化および改善されます.
戦略リスク
- 波動的な市場や反復的な市場では,頻繁に取引するシグナルが過剰取引と滑り場コストの増加を引き起こす可能性があります.
- トレンドの状況では,VWAPのストップを単に頼りにするだけで,戦略が早期に終了し,トレンドの後の利益が失われる可能性があります.
- 固定されたパラメータ設定は,市場環境の変化に適応できない可能性があり,異なる品種と周期に最適化する必要があります.
- OBV指標は取引量に強い依存性があり,取引量データが不真実または操作された場合,指標の誤差は判断を誤導する可能性がある.
- この戦略は,マクロ経済,ニュース面などの外部要因を考慮していないため,極端な状況では効果的でない可能性があります.
最適化の方向
- トレンド確認指数,波動率指数など,震動市場に対してより多くのフィルタリング条件を導入し,頻繁に取引を減らす.
- モバイルストップまたは他のトレンド追跡指標と組み合わせることで,トレンドの状況をよりよく把握できます.
- VWAPとOBV RSIのパラメータを自己適応最適化し,計算周期と値設定を動的に調整する.
- OBV RSI指標の信頼性を高めるために,交付量真偽チェックメカニズムを導入.
- マクロ経済データ分析,感情指標などの戦略の適応性や安定性を強化することを検討する.
要約する
BabyShark VWAP取引戦略は,取引量重み平均価格とエネルギー潮指標の比較的強い指標を融合した量化取引戦略であり,市場の超買い状態とトレンドの動態の変化を捉えることで取引信号を生成する. この戦略の論理は明確で,価格と取引量などの複数の市場要素を組み合わせて,市場の脈動を全面的に把握することができる. 同時に,合理的な止損停止設定とリスク管理機構は,収益を追求する一方で,戦略をリスク管理に兼ねることを可能にします. もちろん,戦略は,変動する市場やトレンドの状況に適応できないこと,およびパラメータ固定などの潜在的な問題もあります.
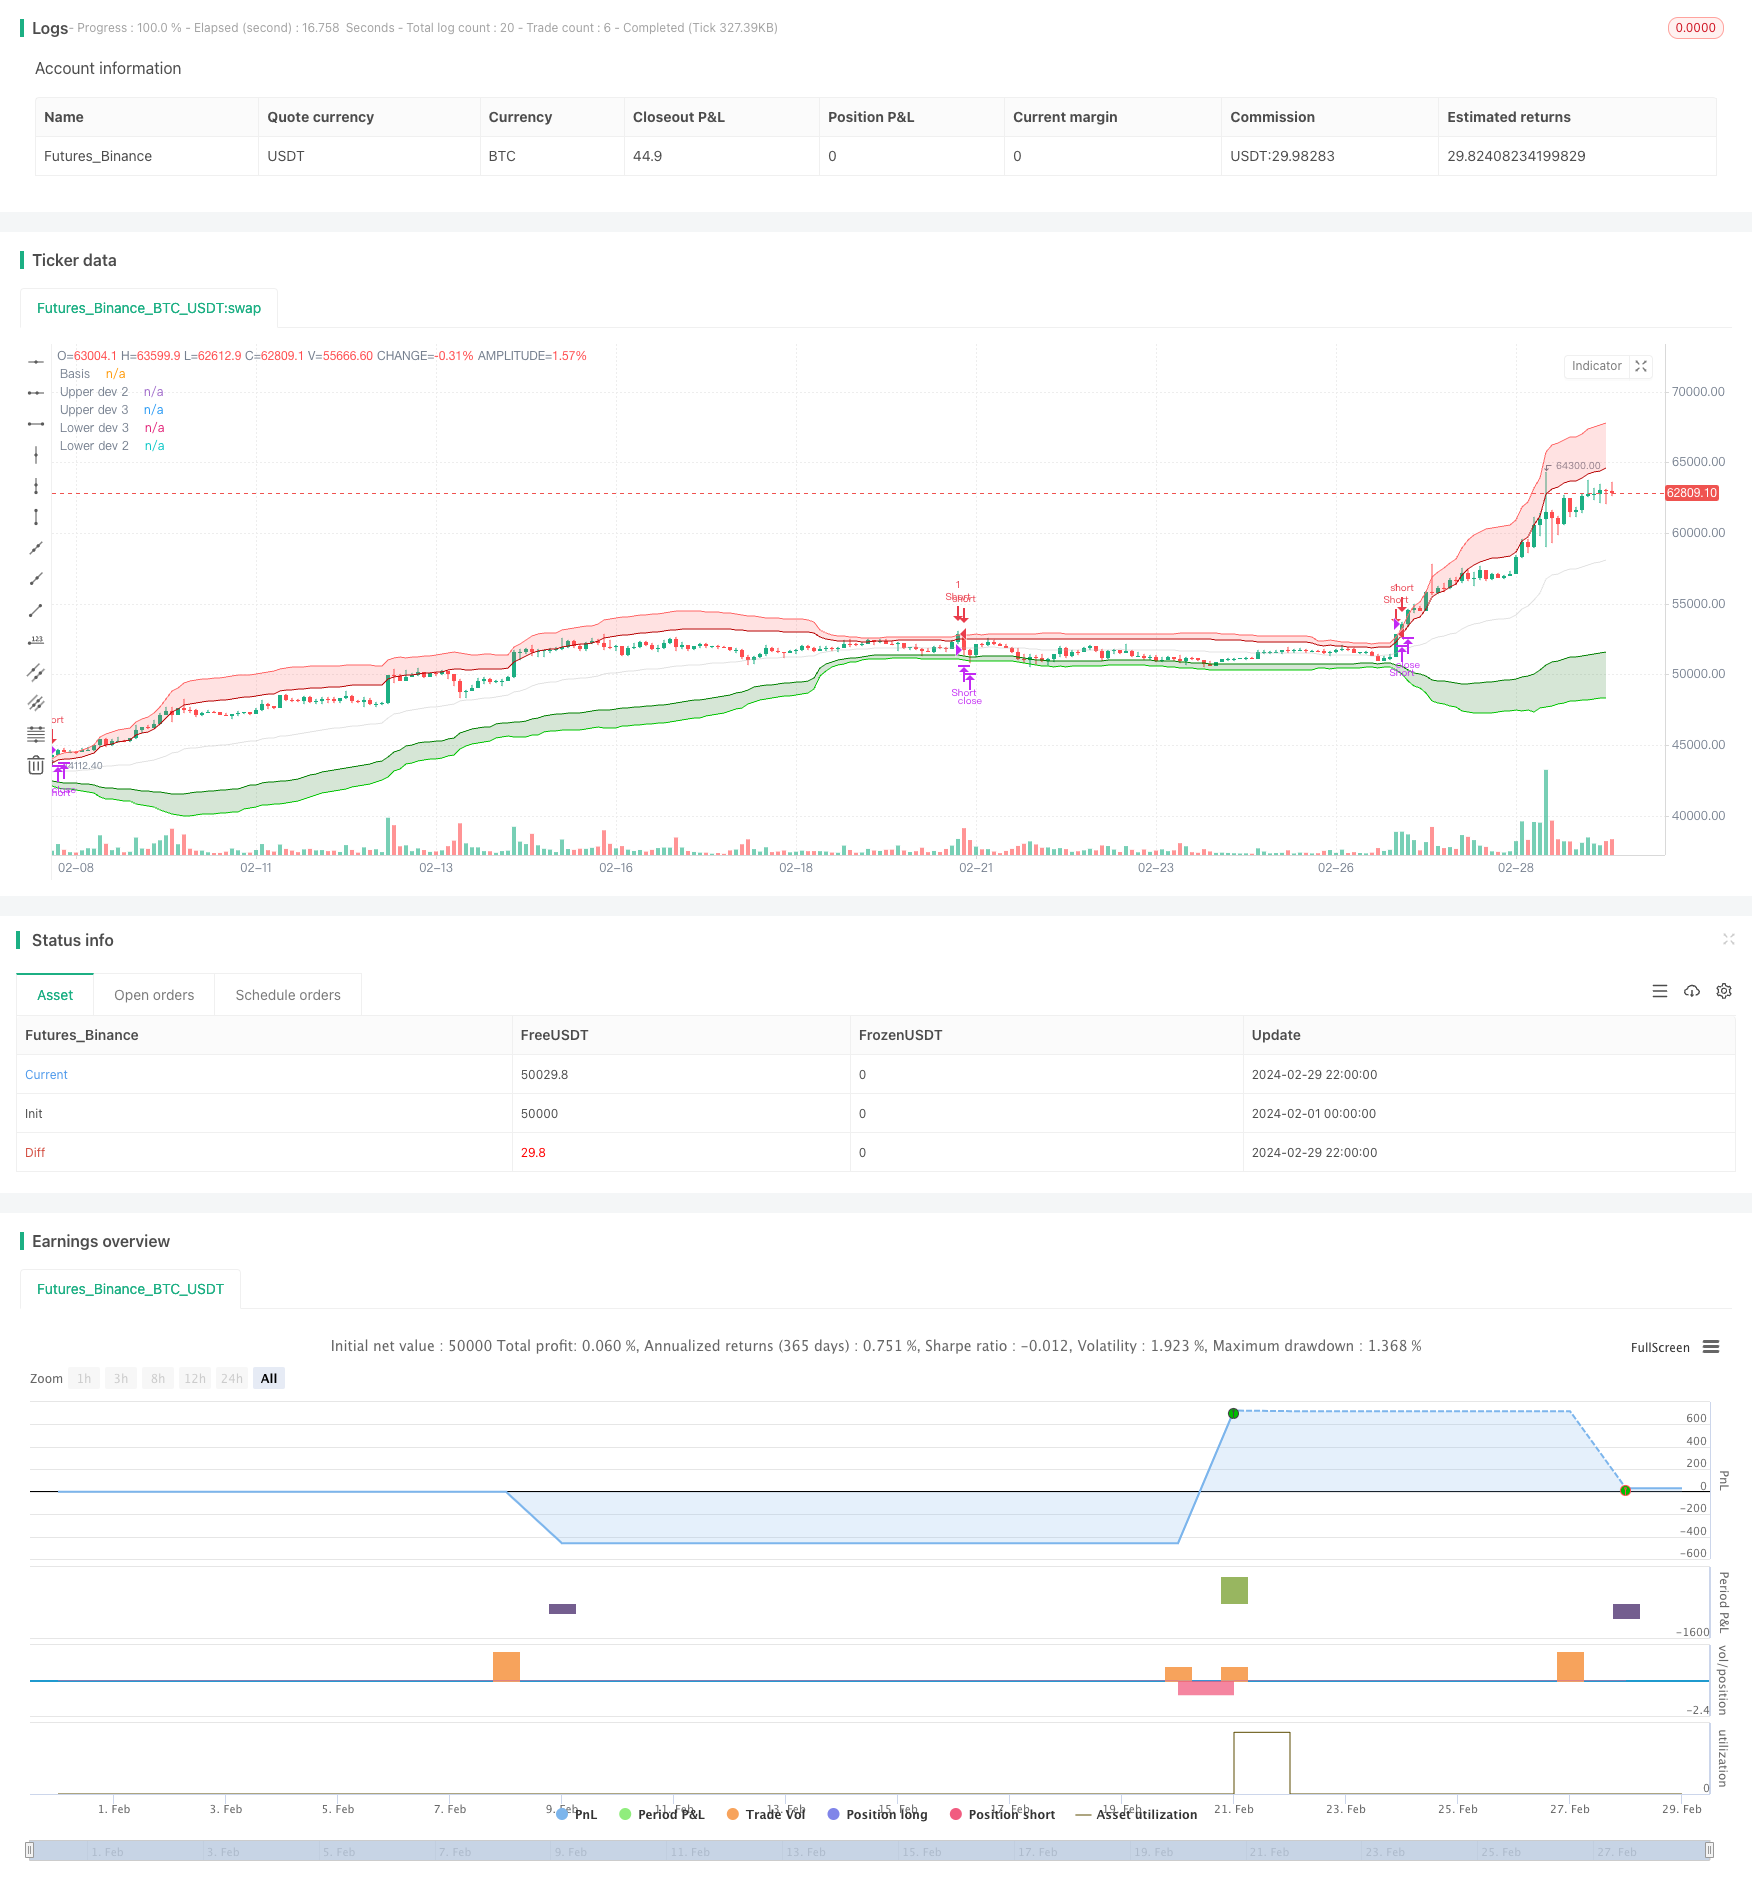
/*backtest
start: 2024-02-01 00:00:00
end: 2024-02-29 23:59:59
period: 2h
basePeriod: 15m
exchanges: [{"eid":"Futures_Binance","currency":"BTC_USDT"}]
*/

// This Pine Script™ code is subject to the terms of the Mozilla Public License 2.0 at https://mozilla.org/MPL/2.0/
// © GreatestUsername

//@version=5
strategy("BabyShark VWAP Strategy", overlay=true, margin_long=100, margin_short=100, calc_on_every_tick = true)


// VWAP
ls = input(false, title='Log-space', group = "Optional")
type = 'Average Deviation'
length = input(60, group="Strategy Modification")
source = input(close, group="Strategy Modification")
_low = ls == true ? math.log(low) : low
_high = ls == true ? math.log(high) : high
src = ls == true ? math.log(source) : source

//weighted mean
pine_vwmean(x, y) =>
    cw = 0.0
    cd = 0.0
    w_sum = 0.0
    d_sum = 0.0
    for i = 0 to y - 1 by 1
        cd := x[i]
        cw := volume[i]
        d_sum += cw * cd
        w_sum += cw
        w_sum
    d_sum / w_sum

//weighted standard deviation
pine_vwstdev(x, y, b) =>
    d_sum = 0.0
    w_sum = 0.0
    cd = 0.0
    for i = 0 to y - 1 by 1
        cd := x[i]
        cw = volume[i]
        d_sum += cw * math.pow(cd - b, 2)
        w_sum += cw
        w_sum
    math.sqrt(d_sum / w_sum)

//weighted average deviation
pine_vwavdev(x, y, b) =>
    d_sum = 0.0
    w_sum = 0.0
    cd = 0.0
    for i = 0 to y - 1 by 1
        cd := x[i]
        cw = volume[i]
        d_sum += cw * math.abs(cd - b)
        w_sum += cw
        w_sum
    d_sum / w_sum

vwmean = pine_vwmean(src, length)

//consider using Average Deviation instead of Standard Deviatio if there are values outside of 3rd upper & lower bands within a rolling window
dev = if type == 'Standard Deviation'
    dev = pine_vwstdev(src, length, vwmean)
    dev
else if type == 'Average Deviation'
    dev = pine_vwavdev(src, length, vwmean)
    dev

basis = ls == true ? math.exp(vwmean) : vwmean
plot(basis, color=color.new(#b7b7b7, 60), title='Basis')

upper_dev_2 = vwmean + dev * 2
upper_dev_3 = vwmean + dev * 3

lower_dev_2 = vwmean - dev * 2
lower_dev_3 = vwmean - dev * 3

fill(
     plot1=plot(ls == true ? math.exp(upper_dev_2) : upper_dev_2, color=color.new(#B20000, 0), title='Upper dev 2'),
     plot2=plot(ls == true ? math.exp(upper_dev_3) : upper_dev_3, color=color.new(#FF6666, 0), title='Upper dev 3', display=display.none),
     color=color.new(#FF4D4D, 80), title='Upper band'
     )
fill(
     plot1=plot(ls == true ? math.exp(lower_dev_3) : lower_dev_3, color=color.new(#00CC00, 0), title='Lower dev 3', display=display.none),
     plot2=plot(ls == true ? math.exp(lower_dev_2) : lower_dev_2, color=color.new(#008000, 0), title='Lower dev 2'),
     color=color.new(#006600, 80), title='Lower band'
     )


// Input to enable or disable the table visibility
table_visible = input(false, title="Show Table", group="Deviation Cross Monitor")
// Input for the number of candles to look back
table_length = input(300, title="Table Lookback Length", group="Deviation Cross Monitor")

// Custom count function
count_occurrences(cond, length) =>
    count = 0
    for i = 0 to length - 1
        if cond[i]
            count := count + 1
    count

// Count occurrences of prices above Upper dev 2 and below Lower dev 2

above_upper_dev_2 = count_occurrences(close > upper_dev_2, table_length)
below_lower_dev_2 = count_occurrences(close < lower_dev_2, table_length)

// Create table in the bottom right corner
var table tbl = table.new(position=position.bottom_right, rows=2, columns=2)

if table_visible
    if barstate.islast
        // Update the table headers
        table.cell(tbl, 0, 0, "Above Upper Dev 2", bgcolor=color.gray, text_color=color.white)
        table.cell(tbl, 0, 1, "Below Lower Dev 2", bgcolor=color.gray, text_color=color.white)

        // Update the table values
        table.cell(tbl, 1, 0, str.tostring(above_upper_dev_2), bgcolor=color.new(color.green, 90), text_color=color.green)
        table.cell(tbl, 1, 1, str.tostring(below_lower_dev_2), bgcolor=color.new(color.red, 90), text_color=color.red)
else
    table.delete(tbl)

// RSI
obvsrc = close
change_1 = ta.change(obvsrc)
obv = ta.cum(ta.change(obvsrc) > 0 ? volume : change_1 < 0 ? -volume : 0 * volume)

src2 = obv
len = input.int(5, minval=1, title="RSI Length", group="Strategy Modification")
up = ta.rma(math.max(ta.change(src2), 0), len)
down = ta.rma(-math.min(ta.change(src2), 0), len)
rsi = down == 0 ? 100 : up == 0 ? 0 : 100 - 100 / (1 + up / down)
higherlvl = input(70, title="Higher Level", group="Strategy Modification")
lowerlvl = input(30, title="Lower Level", group="Strategy Modification")


plot_color = rsi >= higherlvl ? color.red : rsi <= lowerlvl ? color.green : color.new(#b7b7b7, 60)
// plot(rsi, color=plot_color)

//plot(rsi, color=color.white)


// Count occurrences of RSI crossing higher level and lower level
cross_above_higher = ta.crossover(rsi, higherlvl)
cross_below_lower = ta.crossunder(rsi, lowerlvl)
above_higher_count = count_occurrences(cross_above_higher, table_length)
below_lower_count = count_occurrences(cross_below_lower, table_length)

// Create table in the bottom right corner
if (table_visible)
    var table tbl2 = table.new(position=position.bottom_right, rows=2, columns=2)
    if (barstate.islast)
        // Update the table headers
        table.cell(tbl2, 0, 0, "Higher Level Cross", bgcolor=color.gray, text_color=color.white)
        table.cell(tbl2, 0, 1, "Lower Level Cross", bgcolor=color.gray, text_color=color.white)

        // Update the table values
        table.cell(tbl2, 1, 0, str.tostring(above_higher_count), bgcolor=color.new(color.red, 90), text_color=color.red)
        table.cell(tbl2, 1, 1, str.tostring(below_lower_count), bgcolor=color.new(color.green, 90), text_color=color.green)


// Entries

// Long Entry:
// Price is in the shaded GREEN area of [Hoss] VWAP Deviation
// and the [Hoss] OBV RSI is GREEN.
longCondition1 = close <= lower_dev_3
longConditions = plot_color == color.green and longCondition1 and strategy.position_size == 0

// Short Entry:
// Price is in the shaded RED area of [Hoss] VWAP Deviation
// and the [Hoss] OBV RSI is RED.
shortCondition1 = close >= upper_dev_3
shortConditions = plot_color == color.red and shortCondition1 and strategy.position_size == 0

var int lastEntryBar = 0


shortEMA = ta.ema(close, 12)
longEMA = ta.ema(close, 21)
uptrend = shortEMA > longEMA

if longConditions and lastEntryBar < bar_index - 10 //and uptrend
    strategy.entry("Long", strategy.long, stop=close * 0.994)
    lastEntryBar := bar_index

if shortConditions and lastEntryBar < bar_index - 10 //and not uptrend
    strategy.entry("Short", strategy.short, stop=close * 1.006)
    lastEntryBar := bar_index


if strategy.position_size > 0 and (ta.crossover(close, basis) or strategy.opentrades.entry_price(strategy.opentrades - 1) * 0.994 > close)
    strategy.close("Long", immediately = true)
if strategy.position_size < 0 and (ta.crossunder(close, basis) or strategy.opentrades.entry_price(strategy.opentrades - 1) * 1.006 < close)
    strategy.close("Short", immediately = true)

// Stop Loss:
// 0.6%
// After 1 Loss => NO more Trades for 10 Candles (10 minutes) (usually a breakout will happen, and it takes average 10min till it ranges again. So basically wait for range to form again)

// Take Profit:
// Grey line on [Hoss] VWAP Deviation or 0.6%