価格変動範囲に基づく売買シグナルフィルタリング戦略
概要
価格の波動範囲に基づく買入シグナルフィルタリング戦略 (Range Filter Buy Sell Signals Strategy) は,非常に実用的な量化取引戦略である.価格の波動範囲を利用して買入シグナルと売り出シグナルをフィルタリングし,低波動市場では偽信号を減らす,高波動市場では信号品質を上げる.この戦略の名前は,戦略の主要な機能を正確に概説している.
戦略原則
この戦略は,まず,特定の周期における資産価格の波動範囲を計算する.具体的には,指定された周期における最高価格と最低価格の間の差を計算して,価格の波動の幅を決定する.
その後,買取と売却のシグナルを生成する.しかし,すべてのシグナルが入場を誘発するものではなく,価格の波動範囲のフィルタリング条件を満たす必要がある.例えば,価格が波動範囲を破るときのみで買取シグナルを発信する.
このようにして,この戦略は,低波動の市場環境では,ほとんどの偽信号をフィルターして,無意味な入場を避けることができます.高波動の場合は,より大きな方向の動きを捕捉して,そこから利益を得ることができます.
戦略的優位性
この戦略の最大の利点は,信号のフィルタリングの強さを動的に調整できることです.低波動時には,高品質の信号のみを選択します.高波動時には,市場が提供するより多くの機会を掴むことができます.
固定パラメータのフィルターに比べて,この戦略はよりスマートで適応力があります.市場がどのような状態であっても,優れたリスクリターンを提供できます.
さらに,この戦略は,単一の操作条件よりもトレンド方向判断を融合させ,より信頼性の高い取引シグナルを提供します.同時に,それは,個々の取引のリスクを効果的に制御する損失停止機能を備えています.
戦略リスク
この戦略の主なリスクは,波動範囲のパラメータを設定することです. 設定範囲があまりにも大きく,またはあまりにも小さい場合,信号の質と収益の機会に悪影響を及ぼします.
さらに,短期的な価格変動が強い市場では,この戦略の利益を得る機会は比較的少ない.異なる周期システムの組み合わせを採用することで,この問題を緩和するのに役立ちます.
戦略最適化の方向性
この戦略は,以下の方法で最適化できます.
適応パラメータアルゴリズムを使用して,波動範囲のパラメータを自動的に最適化して,よりスマートで動的になります.
大周期的なトレンドに基づくフィルタリングルールを追加し,波動的な市場で巻き込まれるのを避ける.
この戦略は,さまざまな周期を組み合わせて,システムを形成し,全体的な安定性を高めます.
機械学習アルゴリズムを追加し,パラメータ設定とフィルタリング規則の効果を向上させる.
要約する
価格変動範囲に基づく買入シグナルフィルタリング戦略は,非常に実用的で効果的な量化取引戦略である.フィルタリングの強さを動的に調整し,異なる市場環境で優れたリスクリターンを提供することができる.同時に,この戦略には,特にパラメータ最適化とルール最適化に関して,大きな最適化余地があります.全体的に,この戦略は,安定した余剰利益を追求する量化トレーダーにとって非常に良い基礎ソリューションを提供します.
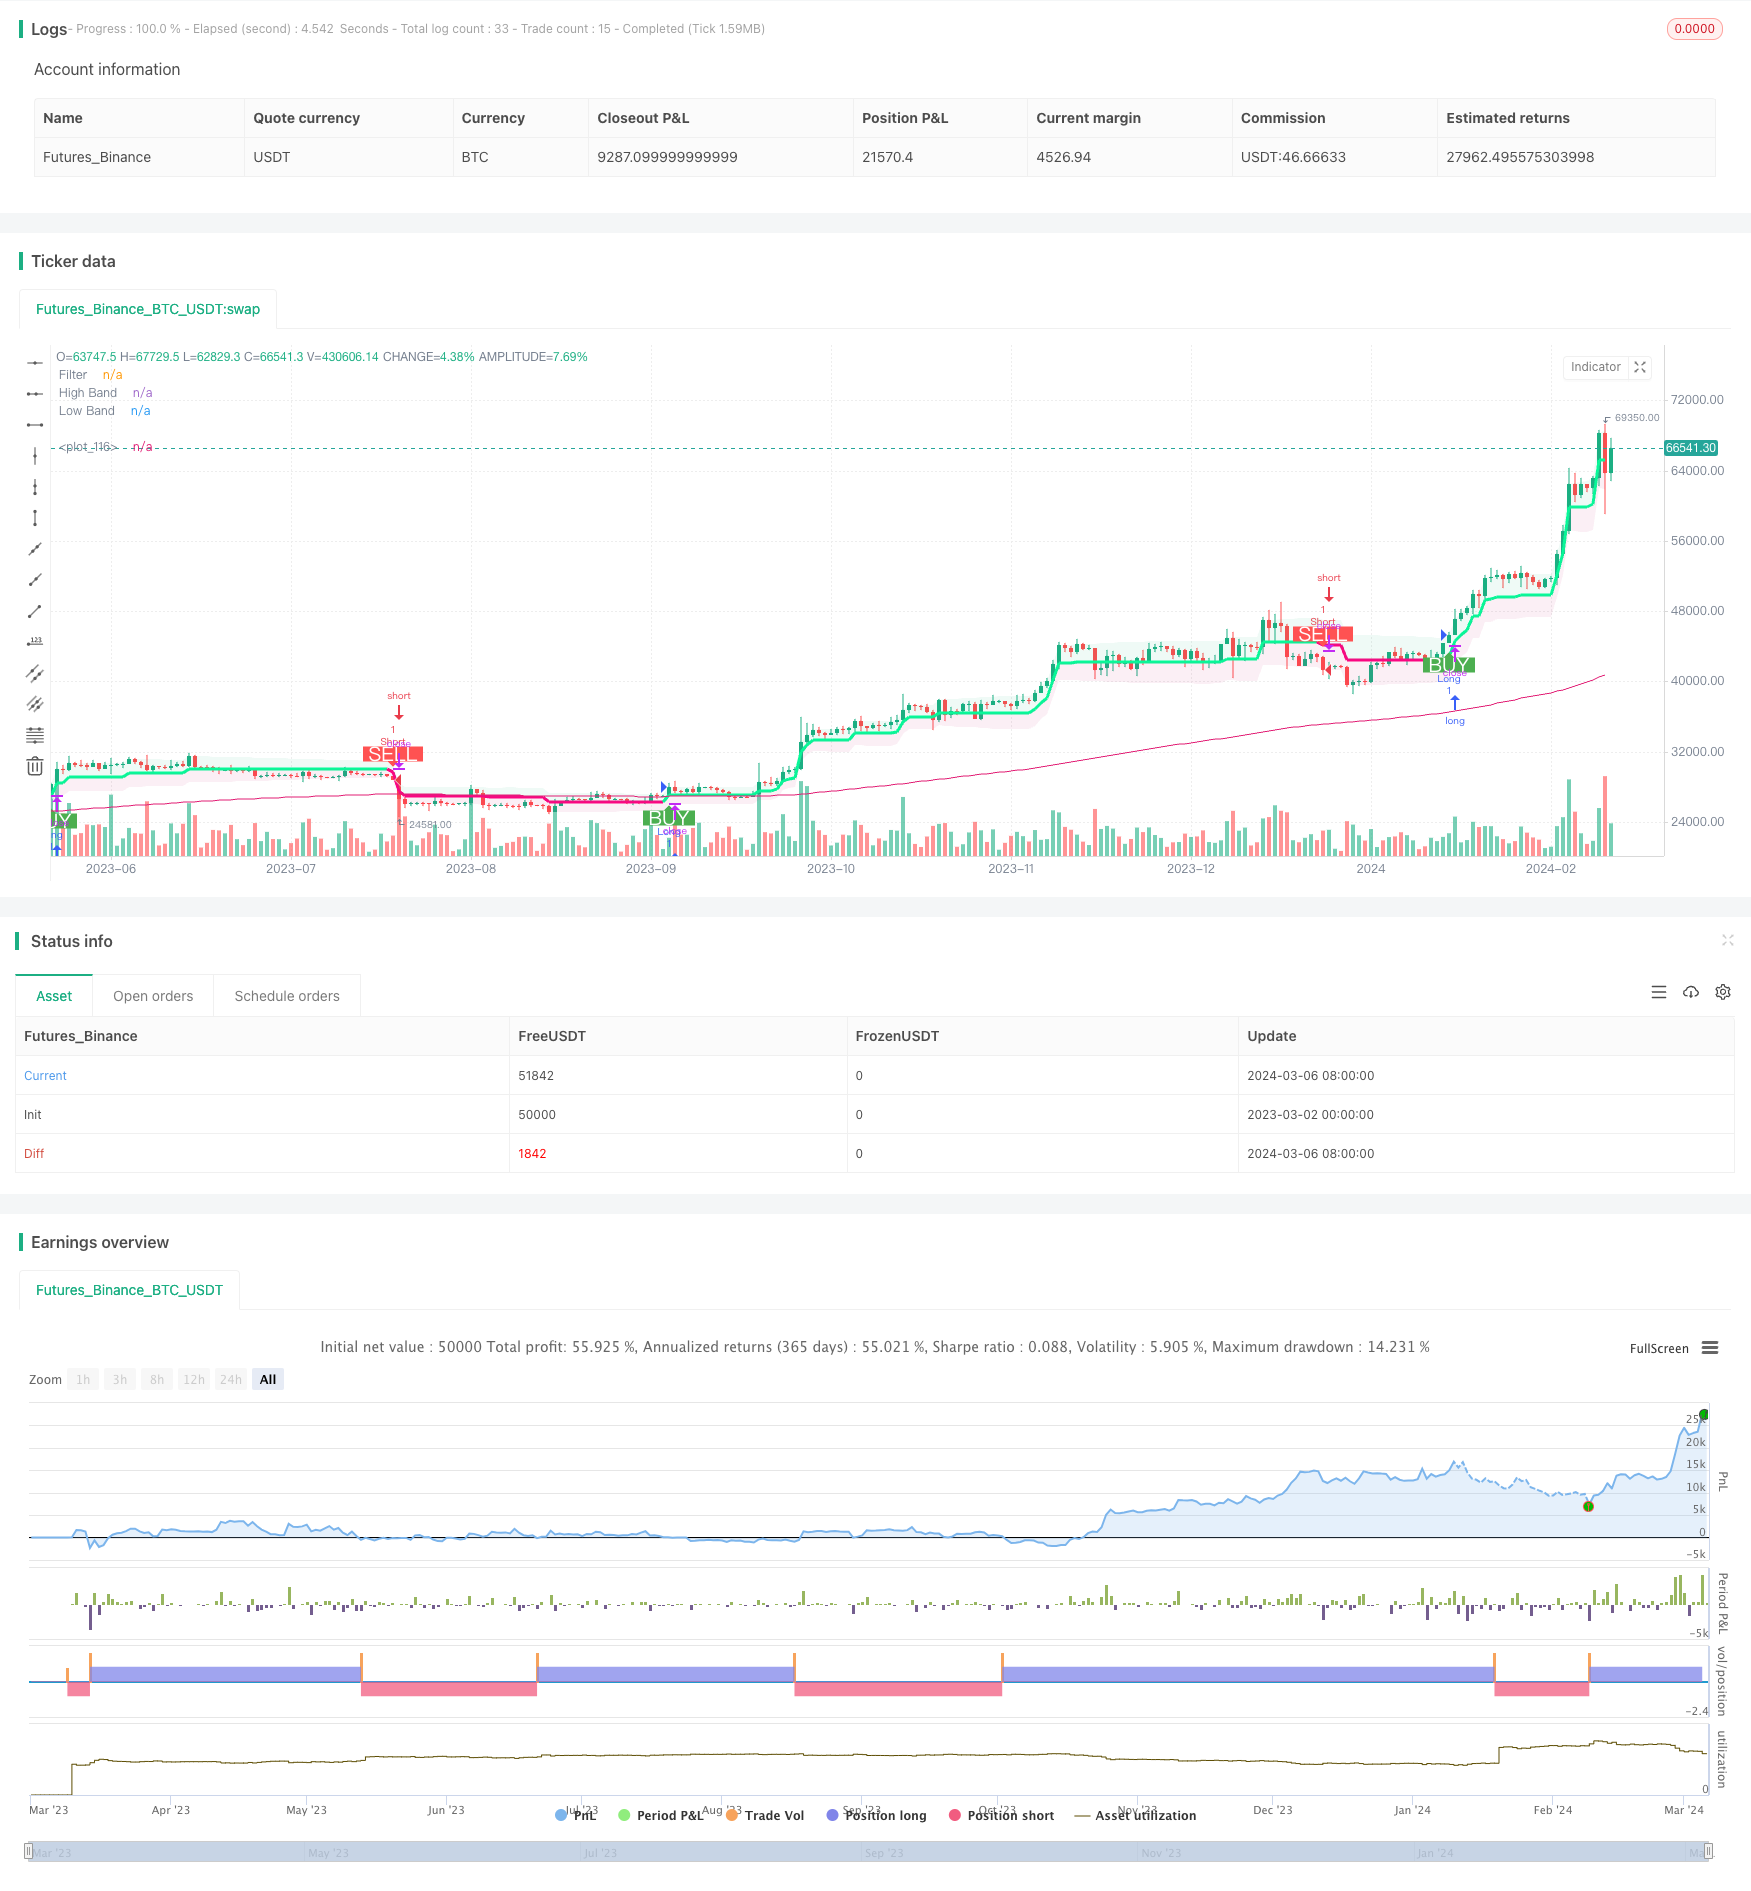
/*backtest
start: 2023-03-02 00:00:00
end: 2024-03-07 00:00:00
period: 1d
basePeriod: 1h
exchanges: [{"eid":"Futures_Binance","currency":"BTC_USDT"}]
*/

// This source code is subject to the terms of the Mozilla Public License 2.0 at https://mozilla.org/MPL/2.0/

// Credits to the original Script - Range Filter DonovanWall https://www.tradingview.com/script/lut7sBgG-Range-Filter-DW/
// This version is the old version of the Range Filter with less settings to tinker with

//@version=5
strategy(title='Range Filter - B&S Signals', shorttitle='[Doan]_RF-B&S Signals', overlay=true)

//-----------------------------------------------------------------------------------------------------------------------------------------------------------------
//Functions
//-----------------------------------------------------------------------------------------------------------------------------------------------------------------
longLossPerc = input.float(title='Long Stop Loss (%)', minval=0.0, step=0.1, defval=1) * 0.01
shortLossPerc = input.float(title='Short Stop Loss (%)', minval=0.0, step=0.1, defval=1) * 0.01

longTakePerc = input.float(title='Long Take(%)', minval=0.0, step=0.1, defval=1) * 0.01
shortTakePerc = input.float(title='Short Take (%)', minval=0.0, step=0.1, defval=1) * 0.01

emaLength = input.int(200, title="EMA Length")

// Determine stop loss price

//Range Size Function
rng_size(x, qty, n) =>
    wper = n * 2 - 1
    avrng = ta.ema(math.abs(x - x[1]), n)
    AC = ta.ema(avrng, wper) * qty
    rng_size = AC

//Range Filter Function
rng_filt(x, rng_, n) =>
    r = rng_
    var rfilt = array.new_float(2, x)
    array.set(rfilt, 1, array.get(rfilt, 0))
    if x - r > array.get(rfilt, 1)
        array.set(rfilt, 0, x - r)
    if x + r < array.get(rfilt, 1)
        array.set(rfilt, 0, x + r)
    rng_filt1 = array.get(rfilt, 0)

    hi_band = rng_filt1 + r
    lo_band = rng_filt1 - r
    rng_filt = rng_filt1
    [hi_band, lo_band, rng_filt]

//-----------------------------------------------------------------------------------------------------------------------------------------------------------------
//Inputs
//-----------------------------------------------------------------------------------------------------------------------------------------------------------------

//Range Source
rng_src = input(defval=close, title='Swing Source')

//Range Period
rng_per = input.int(defval=20, minval=1, title='Swing Period')

//Range Size Inputs
rng_qty = input.float(defval=3.5, minval=0.0000001, title='Swing Multiplier')

//Bar Colors
use_barcolor = input(defval=false, title='Bar Colors On/Off')

//-----------------------------------------------------------------------------------------------------------------------------------------------------------------
//Definitions
//-----------------------------------------------------------------------------------------------------------------------------------------------------------------

//Range Filter Values
[h_band, l_band, filt] = rng_filt(rng_src, rng_size(rng_src, rng_qty, rng_per), rng_per)

//Direction Conditions
var fdir = 0.0
fdir := filt > filt[1] ? 1 : filt < filt[1] ? -1 : fdir
upward = fdir == 1 ? 1 : 0
downward = fdir == -1 ? 1 : 0

//Trading Condition
longCond = rng_src > filt and rng_src > rng_src[1] and upward > 0 or rng_src > filt and rng_src < rng_src[1] and upward > 0
shortCond = rng_src < filt and rng_src < rng_src[1] and downward > 0 or rng_src < filt and rng_src > rng_src[1] and downward > 0

CondIni = 0
CondIni := longCond ? 1 : shortCond ? -1 : CondIni[1]
longCondition = longCond and CondIni[1] == -1
shortCondition = shortCond and CondIni[1] == 1

//Colors
filt_color = upward ? #05ff9b : downward ? #ff0583 : #cccccc
bar_color = upward and rng_src > filt ? rng_src > rng_src[1] ? #05ff9b : #00b36b : downward and rng_src < filt ? rng_src < rng_src[1] ? #ff0583 : #b8005d : #cccccc


ema = ta.ema(close, emaLength)

//-----------------------------------------------------------------------------------------------------------------------------------------------------------------
//Outputs
//-----------------------------------------------------------------------------------------------------------------------------------------------------------------
longStopPrice = strategy.position_avg_price * (1 - longLossPerc)
shortStopPrice = strategy.position_avg_price * (1 + shortLossPerc)

longTakePrice = strategy.position_avg_price * (1 + longTakePerc)
shortTakePrice = strategy.position_avg_price * (1 - shortTakePerc)

//Filter Plot
filt_plot = plot(filt, color=filt_color, linewidth=3, title='Filter', transp=67)

//Band Plots
h_band_plot = plot(h_band, color=color.new(#05ff9b, 100), title='High Band')
l_band_plot = plot(l_band, color=color.new(#ff0583, 100), title='Low Band')

//Band Fills
fill(h_band_plot, filt_plot, color=color.new(#00b36b, 92), title='High Band Fill')
fill(l_band_plot, filt_plot, color=color.new(#b8005d, 92), title='Low Band Fill')

//Bar Color
barcolor(use_barcolor ? bar_color : na)
// Entry
strategy.entry("Long", strategy.long, when=longCondition)
strategy.entry("Short", strategy.short, when=shortCondition)

plot(ema)

//Plot Buy and Sell Labels
plotshape(longCondition, title='Buy Signal', text='BUY', textcolor=color.white, style=shape.labelup, size=size.normal, location=location.belowbar, color=color.new(color.green, 0))
plotshape(shortCondition, title='Sell Signal', text='SELL', textcolor=color.white, style=shape.labeldown, size=size.normal, location=location.abovebar, color=color.new(color.red, 0))

//Alerts
alertcondition(longCondition, title='Buy Alert', message='BUY')
alertcondition(shortCondition, title='Sell Alert', message='SELL')