
1
Follow
1802
Followers
概要
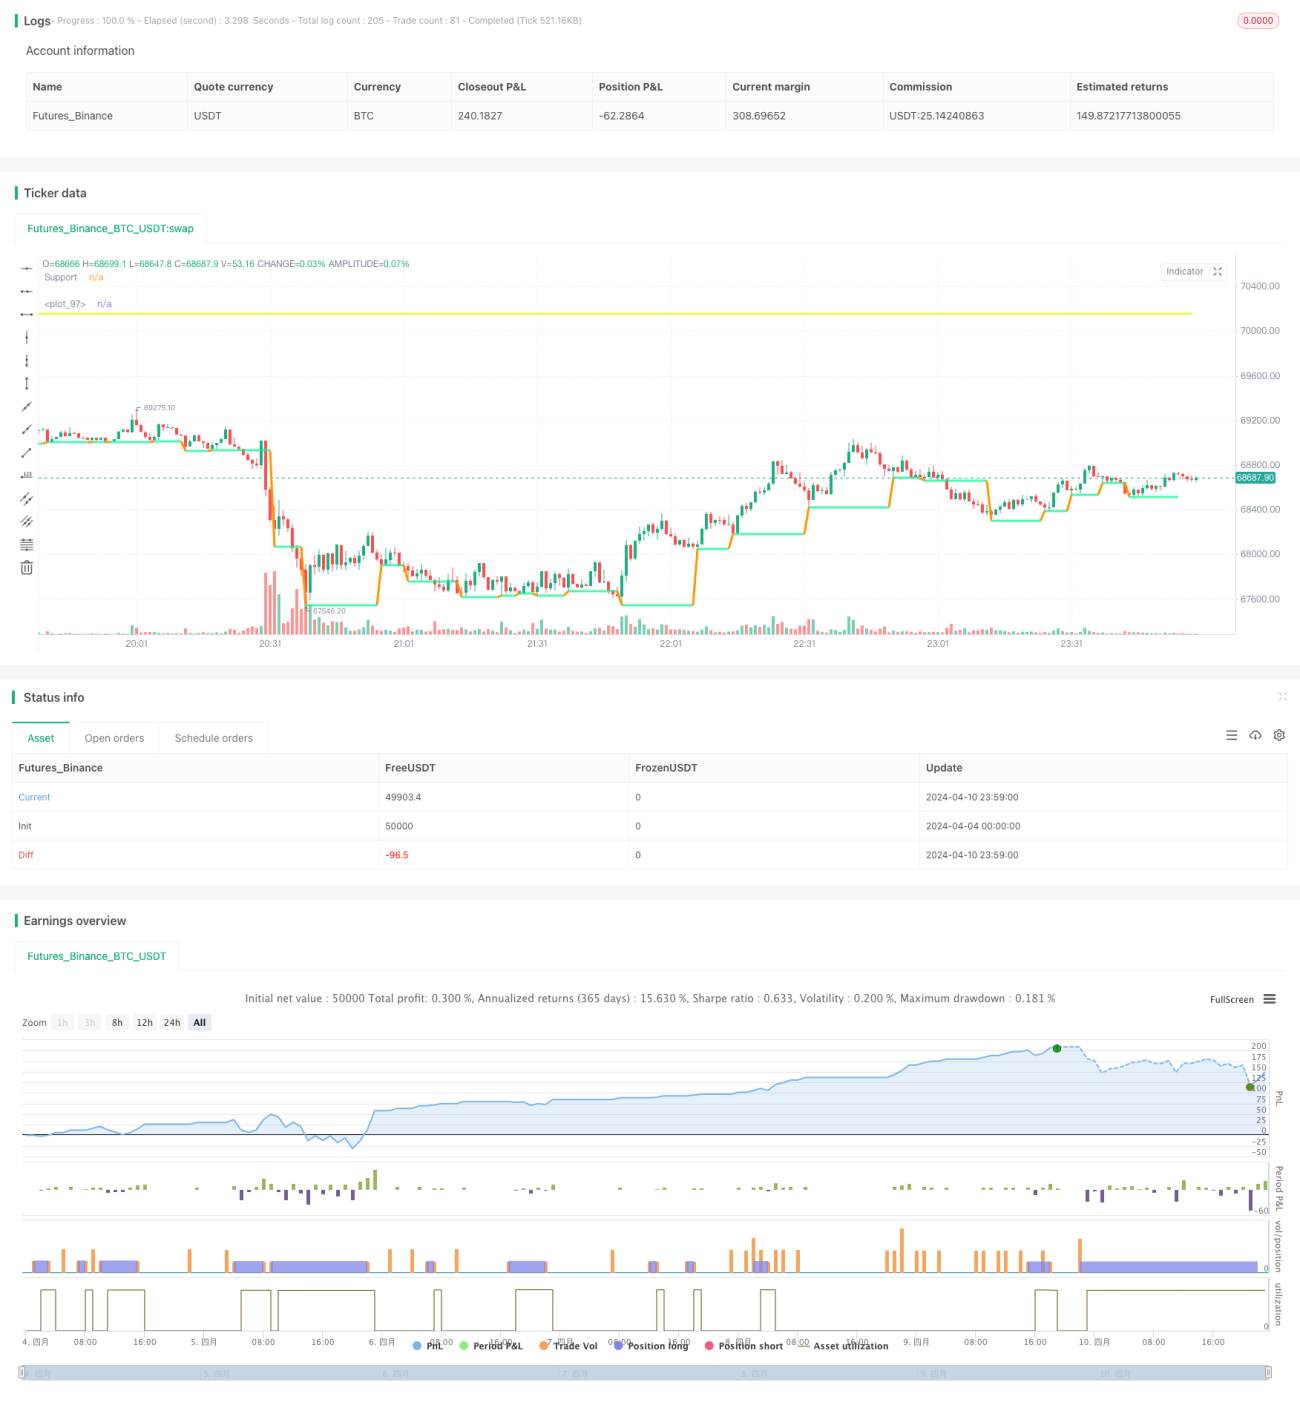
この戦略は、取引量と価格のブレイクアウトに基づく動的DCA戦略です。最近の価格の安値を特定し、価格がその安値を突破し、取引量が増加したときにポジション構築を開始します。価格が下落し続ける過程で、戦略は含み損の大きさに応じて、各回のポジション構築数量を動的に調整し、設定された総ポジション構築回数に達するまで行います。同時に、この戦略は価格下落幅の中央値に基づいて利確価格を設定します。
戦略原理
- ta.pivotlow()関数を使用して最近の価格の安値を特定し、それをサポートレベルとします。
- 過去の価格がサポートレベルを突破した後の下落幅を計算し、その中央値を安全距離および利確幅の参考とします。
- 価格がサポートレベルを突破し、相対取引量が設定された倍数を超えた場合、ポジション構築シグナルが発動します。
- 設定された総ポジション構築回数に基づき、総資金を等割の複数の部分に分割し、各回のポジション構築時に現在の構築回数に応じて構築数量を動的に調整し、ポジションの指数関数的な増加を実現します。
- ポジション構築の過程で、含み損が設定された閾値に達した場合、総ポジション構築回数に達するまで追加ポジションを構築し続けます。
- 価格が利確価格まで上昇した場合、すべてのポジションを決済します。
戦略の利点
- 動的なポジション構築数量調整:価格下落過程での含み損に応じて、各回のポジション構築数量を動的に調整し、リスクを制御すると同時に、価格反発時により多くの利益を得ることができます。
- 過去のデータを参考にパラメータ設定:過去の価格がサポートレベルを突破した後の下落幅を計算し、その中央値を安全距離および利確幅の参考とすることで、戦略パラメータを市場の実情により近づけます。
- 総ポジション構築回数の制限:総ポジション構築回数を設定することで、戦略の総リスクエクスポージャーを制御し、過度なポジション追加による損失を防ぎます。
戦略のリスク
- サポートレベル無効リスク:市場で極端な動きが発生し、価格がサポートレベルを突破した後に大幅に下落し続ける場合、戦略のポジション追加メカニズムが大きな損失をもたらす可能性があります。
- パラメータ設定リスク:戦略のパフォーマンスはパラメータ設定に大きく依存します。パラメータ設定が適切でない場合、戦略のパフォーマンスが低下する可能性があります。
- 利確価格設定リスク:利確価格が高すぎると、一部の利益を逃す可能性があります。低すぎると、早期に決済してしまい、価格反発の機会を十分に活用できない可能性があります。
戦略の最適化方向
- より多くの指標の導入:ポジション構築シグナルの判断において、RSI、MACDなどのより多くのテクニカル指標を導入し、シグナルの精度を高めることができます。
- 資金管理の最適化:市場のボラティリティや口座のリスク許容度などの要因に基づいて、各回のポジション構築における資金比率を動的に調整し、リスクをより適切に制御できます。
- 適応型利確・損切り:市場のボラティリティの変化に応じて、利確・損切りの幅を動的に調整し、市場の変化により適応します。
まとめ
この戦略は、動的なポジション構築数量調整と過去のデータを参考にしたパラメータ設定を通じて、リスクを制御しながら価格反発時により多くの利益を得ることを目指しています。しかし、戦略のパフォーマンスはパラメータ設定や市場状況に大きく依存するため、一定のリスクが依然として存在します。より多くの指標の導入、資金管理の最適化、適応型利確・損切りなどの方法により、戦略のパフォーマンスをさらに向上させることが可能です。
Source
Pine
/*backtest
start: 2024-04-04 00:00:00
end: 2024-04-11 00:00:00
period: 1m
basePeriod: 1m
exchanges: [{"eid":"Futures_Binance","currency":"BTC_USDT"}]
*/

// This Pine Script™ code is subject to the terms of the Mozilla Public License 2.0 at https://mozilla.org/MPL/2.0/
// © AHMEDABDELAZIZZIZO

//@version=5Strategy parameters
Related strategies
Comment
All comments (0)
No data
- 1