SPARK ダイナミックポジションとデュアルインジケーター取引戦略

1
Follow
1780
Followers
概要
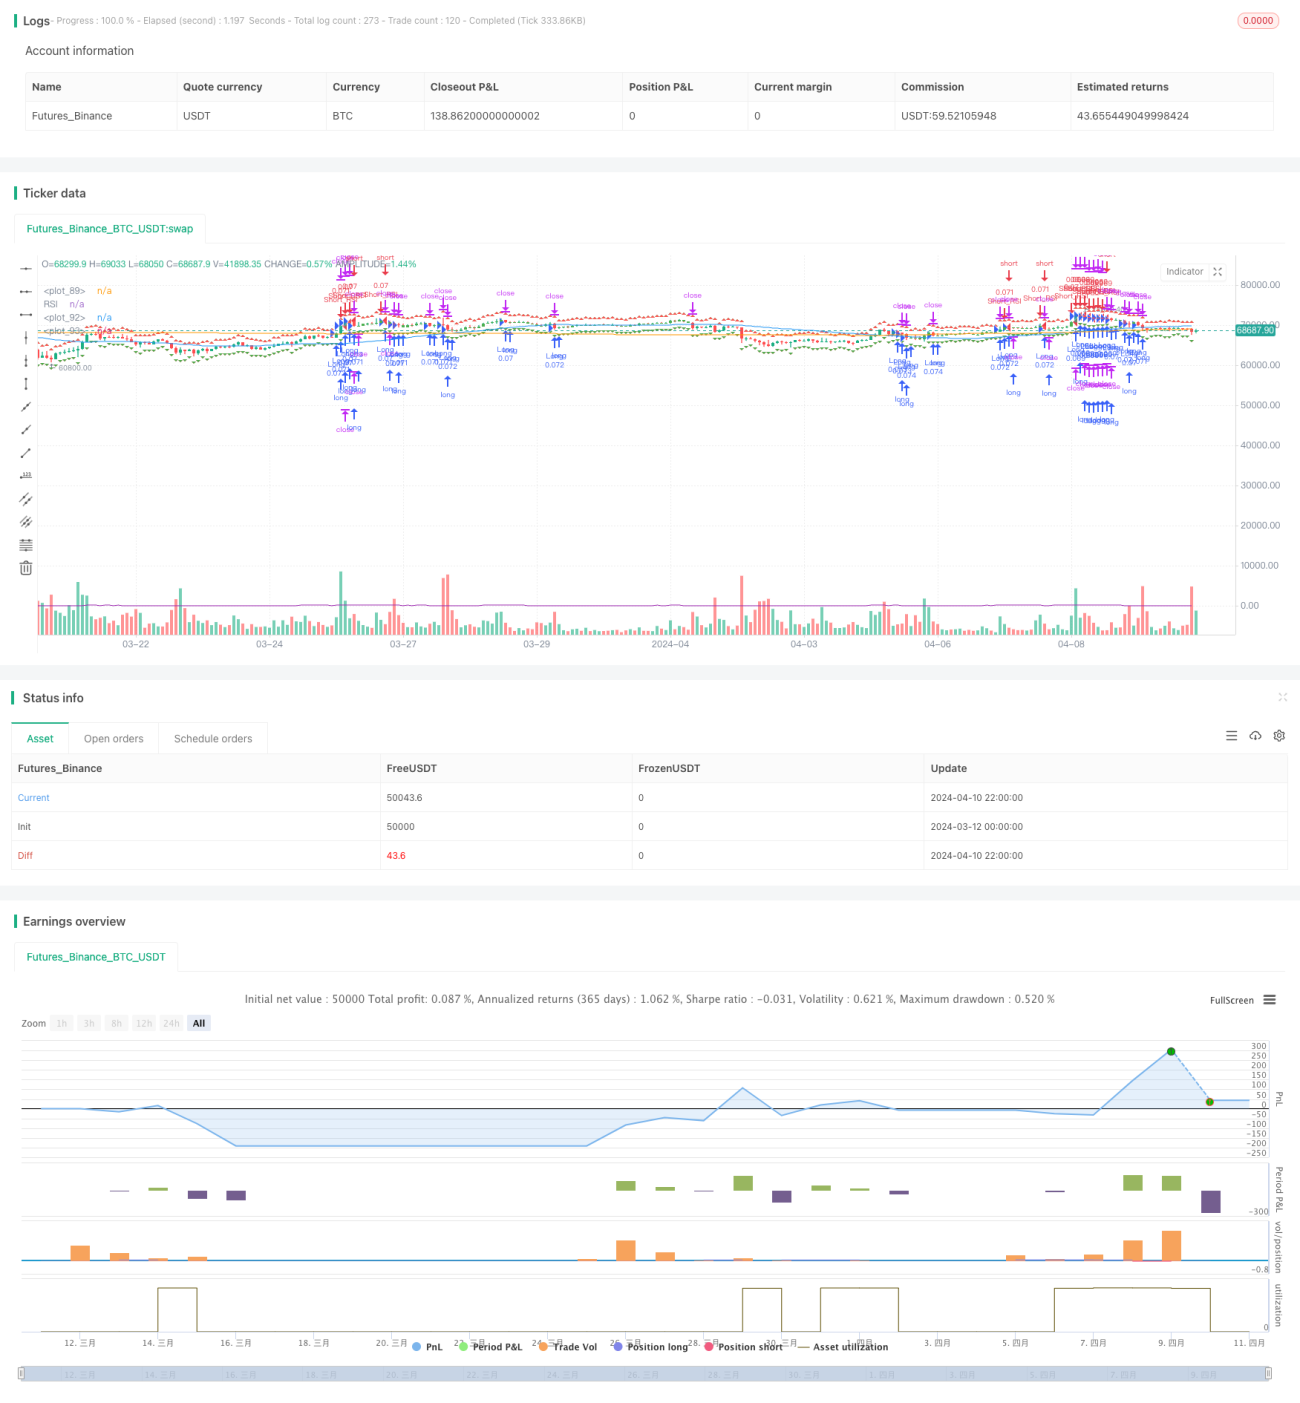
SPARK戦略は,ダイナミックなポジション調整と二重指標の確認を組み合わせた量化取引戦略である.この戦略は,潜在的入場と出口を識別するためにSuperTrend指標と相対的に強い指数 ((RSI) を利用し,ダイナミックなポジション調整メカニズムを使用して資金配分を最適化します.この戦略は,柔軟なストップ&ロスの設定,最小取引頻度制御,方向性好みの選択などのカスタマイズ可能なパラメータも提供しています.
戦略原則
SPARK戦略の核心は,SuperTrend指標とRSI指標の組み合わせの適用である.SuperTrend指標は,クローズオフ価格とダイナミックサポートのレジスタンスポジションの関係を比較してトレンド方向を判断し,RSI指標は,市場の超買い超売り状態を識別するために使用される.SuperTrend指標とRSI指標が特定の条件を同時に満たしているときに,戦略は発動する.
戦略は,ダイナミックなポジション調整メカニズムを使用して,各取引の資金配分を最適化します. ポートフォリオのパーセントとレバレッジ率を設定することにより,戦略は,現在の市場状況と口座のバランスに基づいて,最適なポジションのサイズを自動的に計算できます. さらに,戦略は,固定パーセントまたはダイナミックな計算方法を選択できる柔軟なストップ・ロスの設定を提供します.
戦略的優位性
- 二重指標確認:スーパートレンドとRSIの2つの指標を組み合わせることで,SPARK戦略は潜在的な入場と出場点をより正確に識別し,誤判の可能性を減らすことができます.
- ダイナミックポジション調整:戦略は,ポートフォリオの割合とレバレッジ率に基づいて各取引の資金配分を自動的に最適化して,資金利用の効率性を高めるためのダイナミックポジション調整メカニズムを採用します.
- 柔軟なリスク管理: 戦略は,個人のリスクの好みに応じて固定パーセントまたは動的な計算方法を選択して,正確なリスク制御を実現する柔軟な止損設定を提供します.
- カスタムパラメータ: 戦略は,ユーザが異なる市場条件と取引の好みに合わせて,ATR長さ,倍数,RSI<unk>値などの複数の入力パラメータを調整できるようにします.
戦略リスク
- 市場リスク:SPARK戦略は,二重指標確認と動的ポジション調整メカニズムを採用しているにもかかわらず,極端な市場条件下では,損失のリスクは依然として存在します.
- パラメータ最適化リスク: 策略の性能は,入力パラメータの選択に大きく依存する. 不適切なパラメータ設定は,策略の不良なパフォーマンスを引き起こす可能性があります.
- 過度に適合するリスク:戦略のパラメータが過度に最適化されれば,将来の市場条件で戦略が不良な結果をもたらす可能性があります.
戦略最適化の方向性
- より多くの指標を導入:信号確認の正確性をさらに向上させるために,MACD,ブリン帯など,他の技術指標を導入することを検討する.
- ストップ・ストップ・メカニズムの最適化:利潤を保護し,損失を制限するために,移動ストップ,ダイナミックストップなど,より高度なストップ・ストップ・戦略を探求する.
- 適応パラメータ調整:変化する市場環境に対応するために,市場状況の動向に応じて戦略パラメータを調整する適応メカニズムを開発する.
要約する
SPARK戦略は,スーパートレンドとRSI指標を組み合わせ,ダイナミックなポジション調整機構と柔軟なリスク管理ツールを採用することで,トレーダーに包括的な量化取引ソリューションを提供します.戦略にはいくつかのリスクがある可能性がありますが,継続的な最適化と改善により,SPARK戦略は,さまざまな市場条件下で安定したパフォーマンスを期待しています.
Source
Pine
Strategy parameters
Related strategies
Comment
All comments (0)
No data
- 1