MACD 위일리 전략
저자:차오장, 날짜: 2022-05-09 15:17:57태그:MACD
이 전략은 주로 스칼핑 / 인트라데이 거래에 개발되었습니다. 단기 옵션 거래에 대한 엔트리 / 출구 신호를 식별하는 데 잠재적으로 사용될 수 있습니다. 일반 세션 바 데이터를 사용하여 5 분에서 15 분 사이의 시간 프레임에서 사용되는 경우 인기있는 주식에서 괜찮은 성능을 발휘합니다. EMA, MACD 및 윌리엄 % 범위를 결합하여 긴 및 짧은 신호를 생성합니다.
EMA: 기본값은 200 EMA입니다.
MACD: 기본값은 12/26 길이입니다. 빠른 신호 입력과 느린 신호 입력.
윌리엄 %R - 매끄럽다 (출간): 이것은 원래 윌리엄 %R 라인으로부터 두 개의 이동 평균 라인을 생성하는 사용자 지정 지표입니다.
어떻게 작동하는지: 입국 조건:
- EMA 라인 위에/하단에 바가 닫히면 긴/단기 엔트리
- MACD 라인이 신호 라인의 위/하에 있는 경우 긴/단기 엔트리 (단기 = 히스토그램 > 0, 긴 = < 0)
- 길고 짧은 엔트리 William %R 빠른 MA 라인이 느린 MA 라인의 위/하위
출입 조건:
- MACD 라인이 신호 라인 아래에 있을 때 긴 출구, 짧은 출구에는 역으로
- 길게 나올 때 윌리엄 %R 빠른 MA 라인은 느린 MA 라인의 아래에 있으며, 짧은 출구에 반대의 경우
- William %R 빠른 MA 라인이 과잉 매수 (-20) 한계 아래로 들어가면 긴 출구, 과잉 매수 (-80) 한계 이상에서 짧은 출구.
매개 변수는 특정 주식 / 도구에 최적화되지 않았다는 점에 유의하십시오.
즐기세요~~!!
백테스트
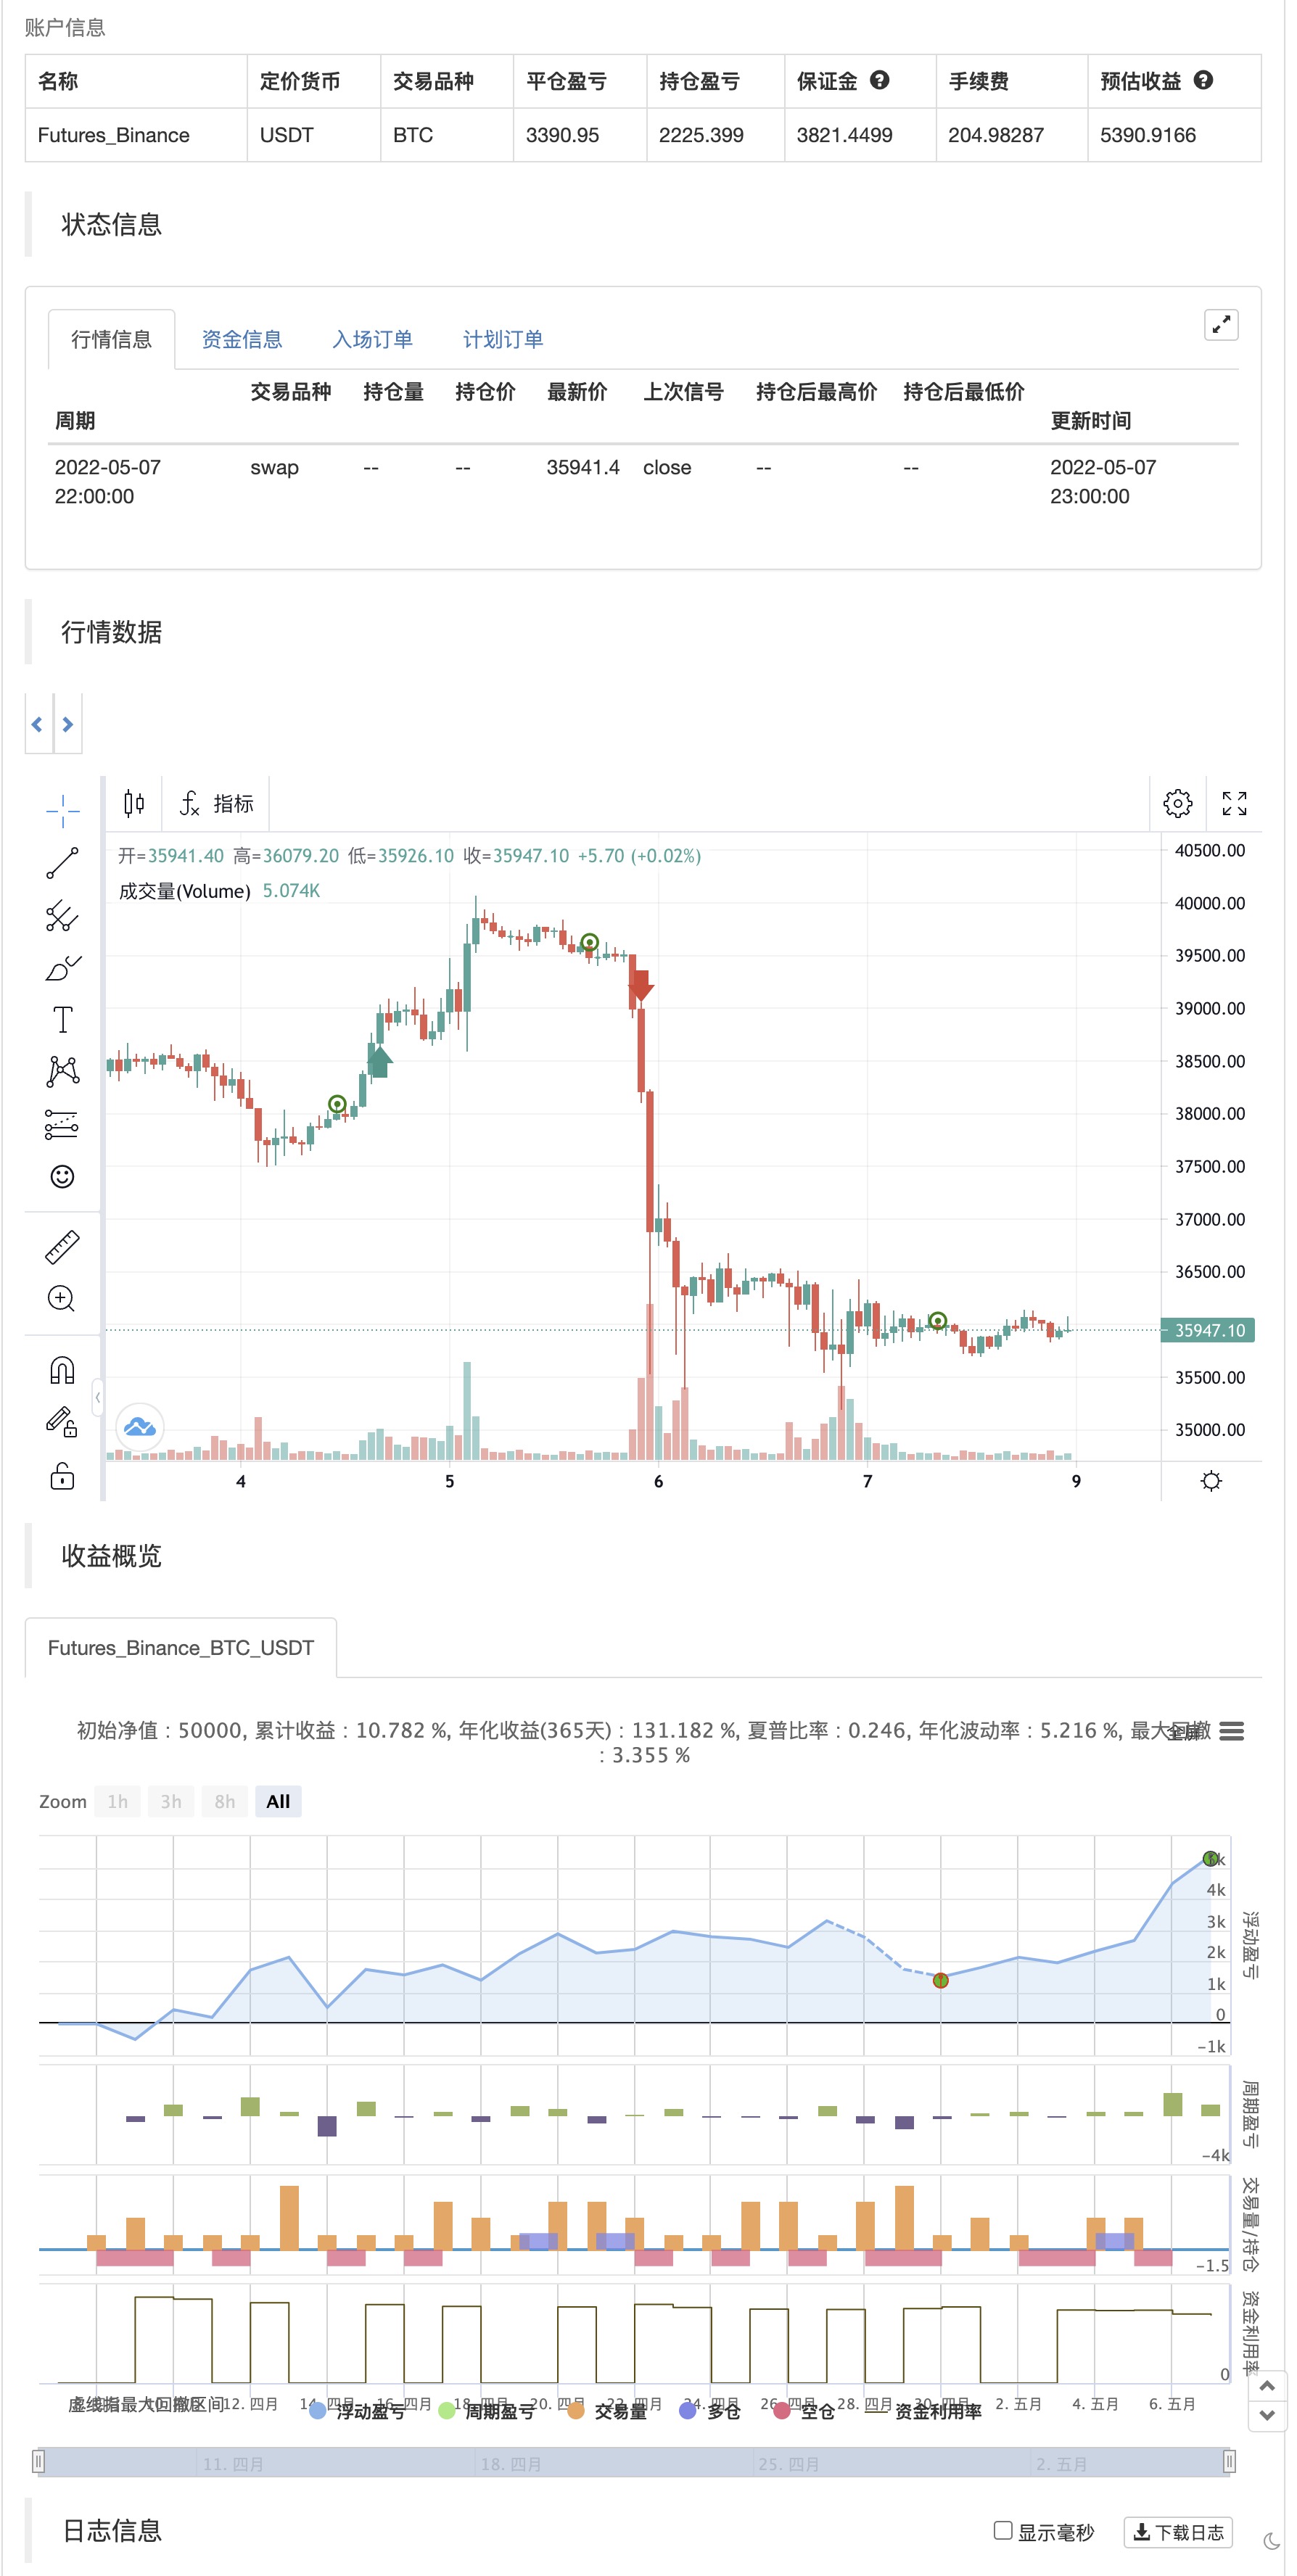
/*backtest
start: 2022-04-08 00:00:00
end: 2022-05-07 23:59:00
period: 1h
basePeriod: 15m
exchanges: [{"eid":"Futures_Binance","currency":"BTC_USDT"}]
*/

// This source code is subject to the terms of the Mozilla Public License 2.0 at https://mozilla.org/MPL/2.0/
// © platsn

//@version=5
strategy("MACD Willy Strategy", overlay=true, pyramiding=1, initial_capital=10000)

// ******************** Trade Period **************************************
startY = input(title='Start Year', defval=2011, group = "Trading window")
startM = input.int(title='Start Month', defval=1, minval=1, maxval=12, group = "Trading window")
startD = input.int(title='Start Day', defval=1, minval=1, maxval=31, group = "Trading window")
finishY = input(title='Finish Year', defval=2050, group = "Trading window")
finishM = input.int(title='Finish Month', defval=12, minval=1, maxval=12, group = "Trading window")
finishD = input.int(title='Finish Day', defval=31, minval=1, maxval=31, group = "Trading window")
//timestart = timestamp(startY, startM, startD, 00, 00)
//timefinish = timestamp(finishY, finishM, finishD, 23, 59)
// t1 = time(timeframe.period, "0945-1545:23456")
// window = time >= timestart and time <= timefinish and t1 ? true : false
// t2 = time(timeframe.period, "0930-1555:23456")
// window2 = time >= timestart and time <= timefinish and t2 ? true : false

leverage = input.float(1, title="Leverage (if applicable)", step=0.1, group = "Trading Options")
reinvest = input.bool(defval=false,title="Reinvest profit", group = "Trading Options")
reinvest_percent = input.float(defval=20, title = "Reinvest percentage", group="Trading Options")
// entry_lookback = input.int(defval=10, title="Lookback period for entry condition", group = "Trading Options")

// -------------------------------------------- Data Source --------------------------------------------

src = input(title="Source", defval=close)

// ***************************************************************************************************** Daily ATR *****************************************************
atrlen = input.int(14, minval=1, title="ATR period", group = "Daily ATR")
iPercent = input.float(5, minval=1, maxval=100, step=0.1, title="% ATR to use for SL / PT", group = "Daily ATR")

percentage = iPercent * 0.01
datr = request.security(syminfo.tickerid, "1D", ta.rma(ta.tr, atrlen))
datrp = datr * percentage

// plot(datr,"Daily ATR")
// plot(datrp, "Daily % ATR")

//*********************************************************** VIX volatility index ****************************************

//VIX = request.security("VIX", timeframe.period, close)
//vix_thres = input.float(20.0, "VIX Threshold for entry", step=0.5, group="VIX Volatility Index")

// ************************************************ Volume ******************************************************

vol_len = input(50, 'Volume MA Period')
avg_vol = ta.sma(volume, vol_len)

//-------------------------------------------------------- Moving Average ------------------------------------

emalen1 = input.int(200, minval=1, title='EMA', group= "Moving Averages")
ema1 = ta.ema(src, emalen1)

// ------------------------------------------ MACD ------------------------------------------
// Getting inputs
fast_length = input(title="Fast Length", defval=12)
slow_length = input(title="Slow Length", defval=26)
signal_length = input.int(title="Signal Smoothing",  minval = 1, maxval = 50, defval = 9)
sma_source = input.string(title="Oscillator MA Type",  defval="EMA", options=["SMA", "EMA"])
sma_signal = input.string(title="Signal Line MA Type", defval="EMA", options=["SMA", "EMA"])
// Plot colors
col_macd = input(#2962FF, "MACD Line  ", group="Color Settings", inline="MACD")
col_signal = input(#FF6D00, "Signal Line  ", group="Color Settings", inline="Signal")
col_grow_above = input(#26A69A, "Above   Grow", group="Histogram", inline="Above")
col_fall_above = input(#B2DFDB, "Fall", group="Histogram", inline="Above")
col_grow_below = input(#FFCDD2, "Below Grow", group="Histogram", inline="Below")
col_fall_below = input(#FF5252, "Fall", group="Histogram", inline="Below")
// Calculating
fast_ma = sma_source == "SMA" ? ta.sma(src, fast_length) : ta.ema(src, fast_length)
slow_ma = sma_source == "SMA" ? ta.sma(src, slow_length) : ta.ema(src, slow_length)
macd = fast_ma - slow_ma
signal = sma_signal == "SMA" ? ta.sma(macd, signal_length) : ta.ema(macd, signal_length)
hist = macd - signal

// ---------------------------------------- William %R --------------------------------------
w_length = input.int(defval=34, minval=1)
w_upper = ta.highest(w_length)
w_lower = ta.lowest(w_length)

w_output = 100 * (close - w_upper) / (w_upper - w_lower)

fast_period = input(defval=5, title='Smoothed %R Length')
slow_period = input(defval=13, title='Slow EMA Length')

w_fast_ma = ta.wma(w_output,fast_period)
w_slow_ma = ta.ema(w_output,slow_period)


// ------------------------------------------------ Entry Conditions ----------------------------------------

L_entry1 = close > ema1 and hist > 0 and w_fast_ma > w_slow_ma
S_entry1 = close < ema1 and hist < 0 and w_fast_ma < w_slow_ma

// -------------------------------------------------- Entry -----------------------------------------------

//profit = strategy.netprofit
//trade_amount = math.floor(strategy.initial_capital*leverage / close)

//if strategy.netprofit > 0 and reinvest
//    trade_amount := math.floor((strategy.initial_capital+(profit*reinvest_percent*0.01))*leverage / close)
//else
//    trade_amount := math.floor(strategy.initial_capital*leverage/ close)


if L_entry1 //and window
    strategy.entry("Long", strategy.long)

if S_entry1 //and window
    strategy.entry("Short", strategy.short)

// --------------------------------------------------- Exit Conditions -------------------------------------

L_exit1 = hist < 0 and w_fast_ma < w_slow_ma and w_fast_ma < -20
S_exit1 = hist > 0 and w_fast_ma > w_slow_ma and w_fast_ma > -80

// ----------------------------------------------------- Exit ---------------------------------------------

if L_exit1 //and window2
    strategy.close("Long")

if S_exit1 //and window2
    strategy.close("Short")

// if time(timeframe.period, "1530-1600:23456")
//     strategy.close_all()
관련
- MACD RSI 이치모쿠 모멘텀 트렌드
- 연속 MACD 금색과 죽음의 십자가에 기초한 거래 전략
- RSI/MACD/ATR과 함께 강화된 EMA 크로스오버 전략
- MACD와 RSI 결합된 장기 거래 전략
- 다중 지표 조합 전략 (CCI, DMI, MACD, ADX)
- 전략에 따른 다중 지표 트렌드
- CCI, DMI, MACD 하이브리드 장기 단기 전략
- 엘리엇 파동 이론 4-9 충동 파동 자동 탐지 거래 전략
- MACD 골든 크로스와 데스 크로스 전략
- MACD-V 및 피보나치 다중 시간 프레임 동적 영업 전략
- MACD BB 브레이크업 전략
더 많은
- 이동 평균 구매 판매
- 미다스 Mk. II - 최고의 암호화 스윙
- TMA-레거시
- TV의 높고 낮은 전략
- 가장 좋은 트레이딩 뷰 전략
- 빅 스냅퍼 경고 R3.0 + Chaiking 변동성 상태 + TP RSI
데 크롤 스톱 - CCI + EMA와 RSI 크로스 전략
- EMA 대역 + leledc + Bollinger 대역 트렌드 포스팅 전략
- RSI MTF Ob+Os
- RSI - 구매 판매 신호
- 하이킨-아시 추세
- HA 시장 편견
- 이치모쿠 클라우드 매끄러운 오시레이터
- 윌리엄스 %R - 부드럽다
- QQE MOD + SSL 하이브리드 + 와다 아타르 폭발
- Strat를 구매/판매
- EMA와 ADX와 함께 트리플 슈퍼트렌드
- 톰 데마크 연속 열 지도
- jma + dwma 다 곡물