TMA-레거시
저자:차오장, 날짜: 2022-05-09 22:38:11태그:RSI
이것은 PhoenixBinary의 원래 TMA-RSI 디버전스 지표에 기반한 스크립트입니다. 피닉스 바이너리 커뮤니티와 TMA 커뮤니티는 피닉스 바이너리 (Phoenix Binary) 가 사망한 후 커뮤니티의 추가 사용 및 개정을 위해 이 버전을 공개 코드로 만들었습니다.
의도된 용도는 원본과 동일하지만 일부 계산은 다르며 원본과 동일한 작용이나 신호가 없을 수 있습니다.
원래 게시된 지표의 설명. 이 지표는 아티와 크리스티로부터 영감을 받았습니다.
█ 구성요소
이 지표의 간결한 개요는 원래 게시된 지표입니다.
1
2
3
백테스트
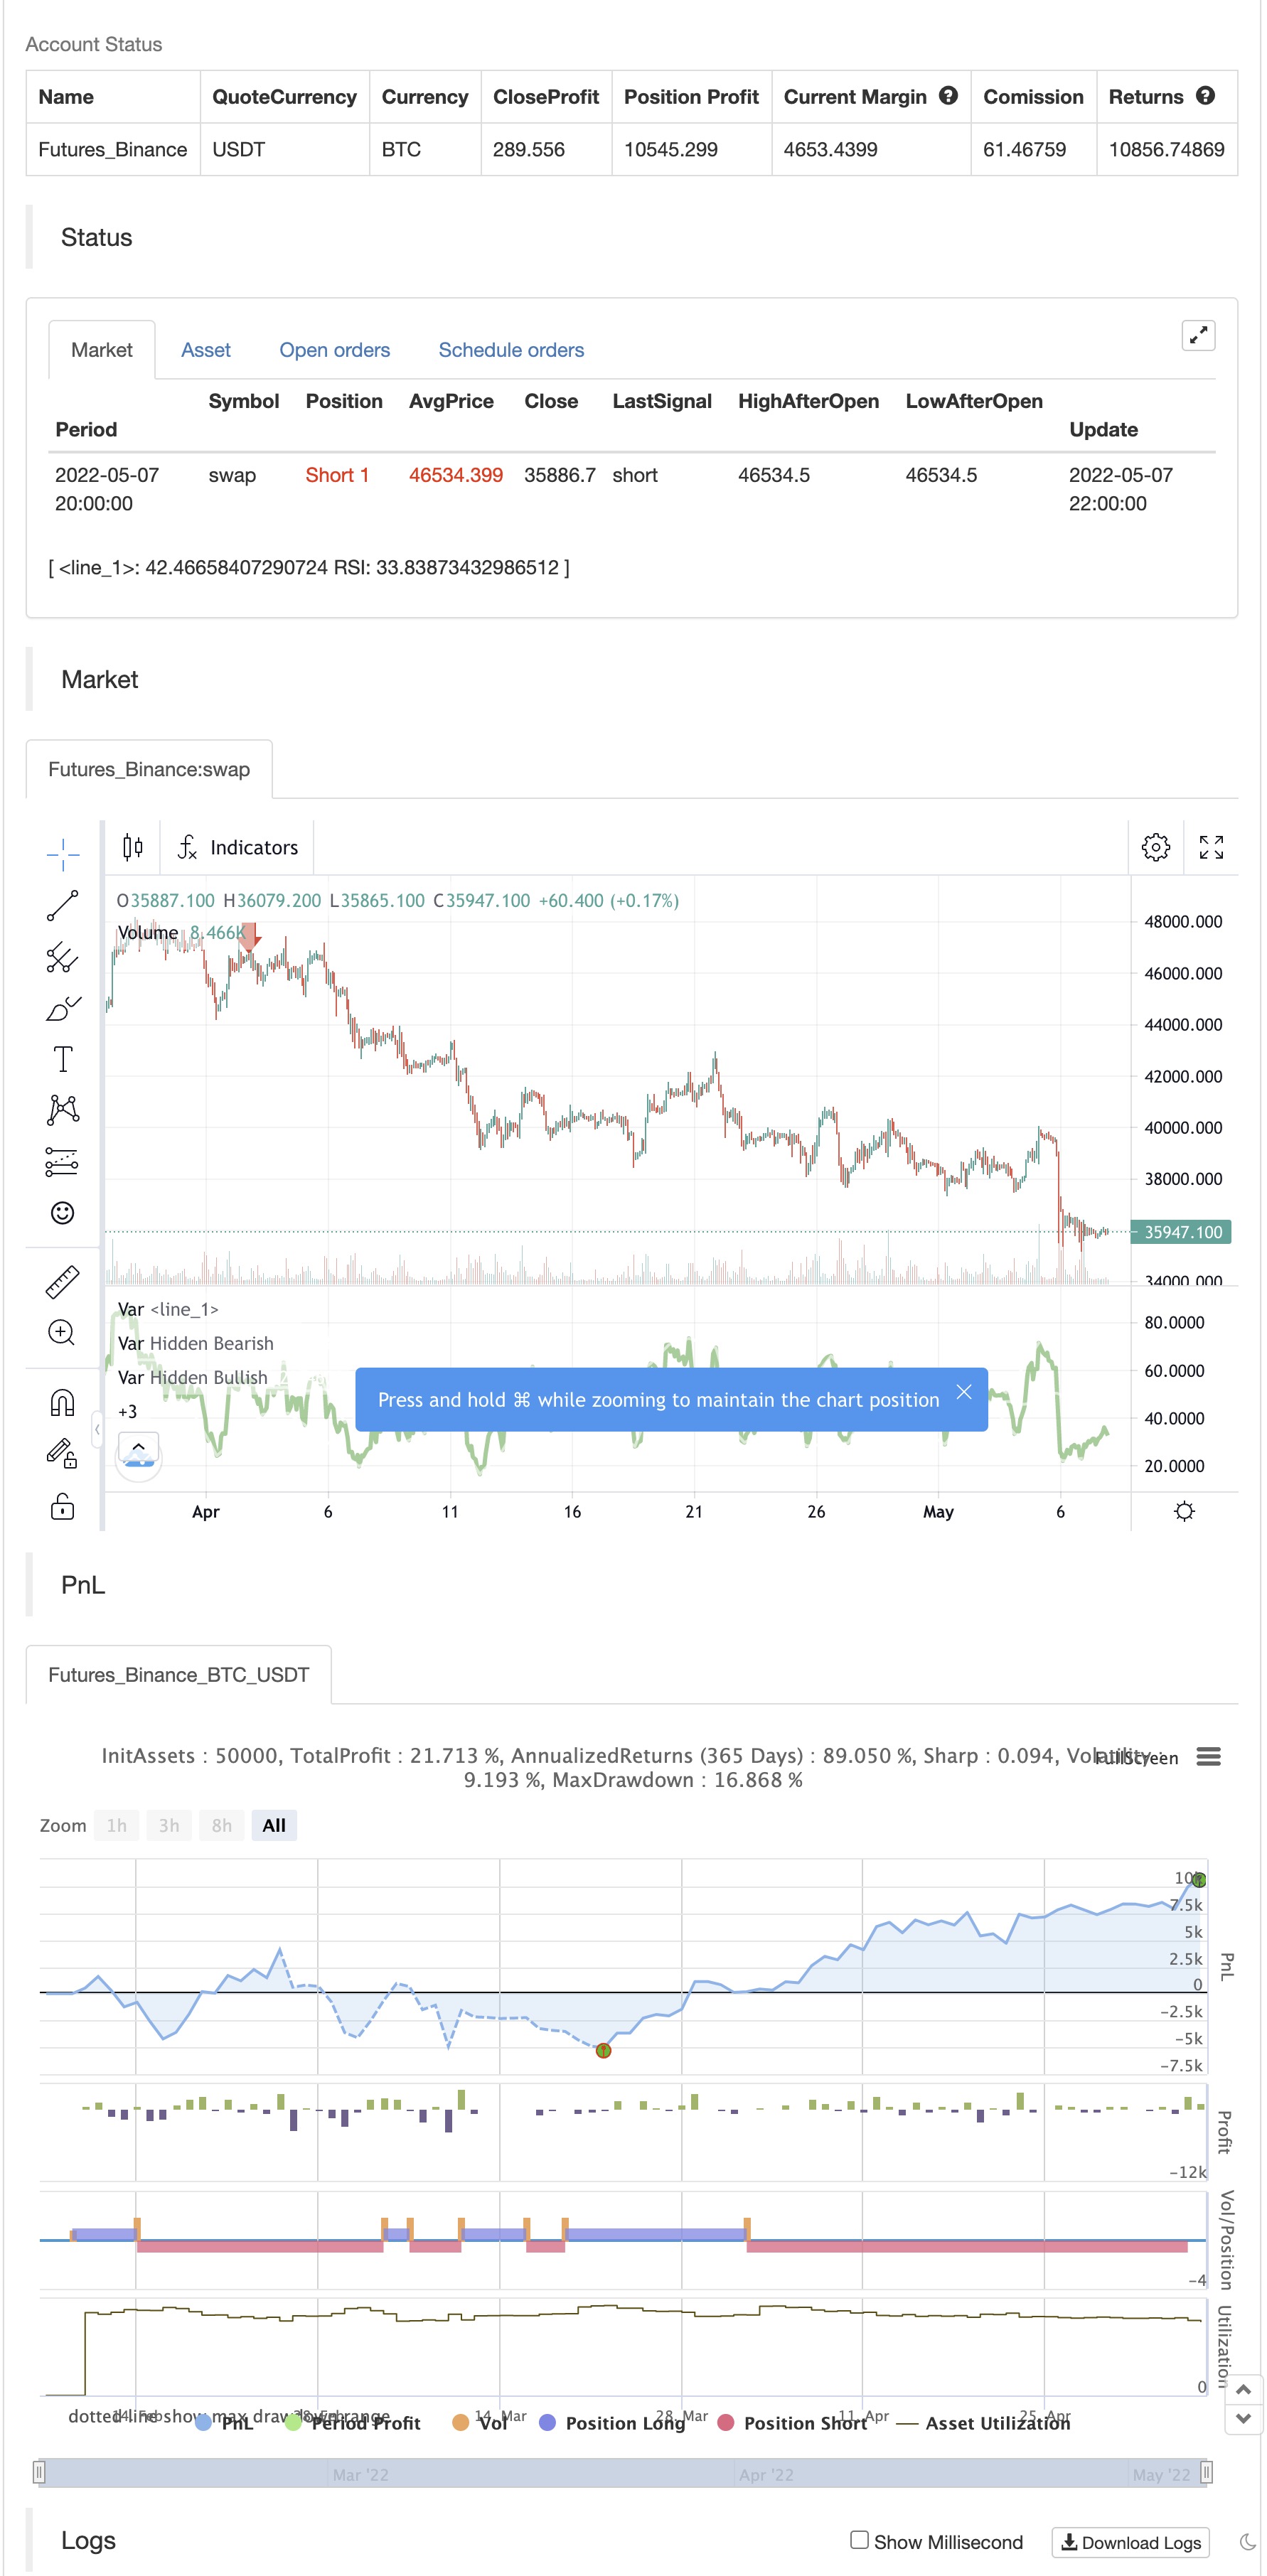
/*backtest
start: 2022-02-08 00:00:00
end: 2022-05-08 00:00:00
period: 2h
basePeriod: 15m
exchanges: [{"eid":"Futures_Binance","currency":"BTC_USDT"}]
*/

//// This source code is subject to the terms of the Mozilla Public License 2.0 at https://mozilla.org/MPL/2.0/
// ©Hotchachachaa, Rest in Peace Pheonix Algo(aka Doug) your community misses you and we extend our deepest sympathies to your family.
//@version=5
//
//This indicator is based on the TMA-Divergence indicator created by PhoenixBinary for the TMA discord Community. Since Phoenix is no longer part of the community
//we did our best to recreate the indicator for the community's continued use updates and revisions.
indicator("TMA-Legacy", overlay=false)

////////////////////////////////////inputs////////////////////////////////////////////////

displayRSI = input.string(title="RSI Type", defval="RSI Divergence", options=["RSI Divergence","RSI Smoothed","RSI Momentum"],group="Main Settings")
lenrsinordiv = input.int(title="RSI Normal Length", defval=14,minval=1, group= "RSI Normal")
lenrsismodiv = input.int(title="RSI Smoothed Length", defval=40, minval=1,group = "RSI Smoothed" )
lenrsissmoma = input.int(title="RSI Smoothed MA", defval=40,minval=1, group = "RSI Smoothed" )
lenrsimomdiv = input.int(title="RSI Normal Length", defval=5 ,minval=1, group = "RSI Momentum")
rsimommalen = input.int(34, minval=1, title="Smooth RSI MA Length",group="RSI Momentum")
srcrsidiv = input(title="RSI Source", defval=close, group="Main Settings")
lbR = input.int(title="Pivot Lookback Right", defval=5,minval=1,group="Divergence Spotter")
lbL = input.int(title="Pivot Lookback Left", defval=5,minval=1,group="Divergence Spotter")
rangeUpper = input.int(title="Max of Lookback Range", defval=60,minval=1,group="Divergence Spotter")
rangeLower = input.int(title="Min of Lookback Range", defval=5,minval=1,group="Divergence Spotter")
plotBull = input.bool(title="Plot Bullish", defval=true,group="Divergence Spotter")
plotHiddenBull = input.bool(title="Plot Hidden Bullish", defval=true,group="Divergence Spotter")
plotBear = input.bool(title="Plot Bearish", defval=true,group="Divergence Spotter")
plotHiddenBear = input.bool(title="Plot Hidden Bearish", defval=true,group="Divergence Spotter")
bearColorrsidiv = color.red
bullColorrsidiv = color.green
hiddenBullColor = color.new(color.green, 80)
hiddenBearColor = color.new(color.red, 80)
textColor = color.white
noneColor = color.new(color.white, 100)
lenDisplay= displayRSI == "RSI Divergence" ? lenrsinordiv: displayRSI == "RSI Smoothed" ? lenrsismodiv: na
rsiValue1 = ta.rsi(srcrsidiv, lenrsinordiv)

// ### Smoothed MA

averageSource = rsiValue1
typeofMA1 = "SMMA"
length_ma1 = 50
f_smma(averageSource, averageLength) =>
    smma = 0.0
    smma := na(smma[1]) ? ta.sma(averageSource, averageLength) : (smma[1] * (averageLength - 1) + averageSource) / averageLength
    smma

f_smwma(averageSource, averageLength) =>
    smwma = 0.0
    smwma := na(smwma[1]) ? ta.wma(averageSource, averageLength) : (smwma[1] * (averageLength - 1) + averageSource) / averageLength
    smwma

f_tma(averageSource, averageLength) =>
    ta.sma(ta.sma(averageSource, averageLength), averageLength)

f_dema(averageSource, averageLength) =>
    emaValue = ta.ema(averageSource, averageLength)
    2 * emaValue - ta.ema(emaValue, averageLength)

f_tema(averageSource, averageLength) =>
    ema1 = ta.ema(averageSource, averageLength)
    ema2 = ta.ema(ema1, averageLength)
    ema3 = ta.ema(ema2, averageLength)
    (3 * ema1) - (3 * ema2) + ema3

f_ma(smoothing, averageSource, averageLength) =>
	switch str.upper(smoothing)
        "SMA"  => ta.sma(averageSource, averageLength)
        "EMA"  => ta.ema(averageSource, averageLength)
        "WMA"  => ta.wma(averageSource, averageLength)
        "HMA"  => ta.hma(averageSource, averageLength)
        "RMA"  => ta.rma(averageSource, averageLength)
        "SWMA" => ta.swma(averageSource)
        "ALMA" => ta.alma(averageSource, averageLength, 0.85, 6)
        "VWMA" => ta.vwma(averageSource, averageLength)
        "VWAP" => ta.vwap(averageSource)
        "SMMA" =>  f_smma(averageSource, averageLength)
        "SMWMA" =>  f_smwma(averageSource, averageLength)
        "DEMA" => f_dema(averageSource, averageLength)
        "TEMA"=>  f_tema(averageSource, averageLength)
        => runtime.error("Moving average type '" + smoothing +
             "' not found!"), na


MA1 = f_ma(typeofMA1, averageSource, length_ma1)
showNormal=displayRSI=="RSI Divergence"
showSmoothed=displayRSI=="RSI Smoothed"
showMomentum = displayRSI =="RSI Momentum"
showAll= displayRSI=="All Three"
///////OB/OS lines

hline(showNormal or showSmoothed ? 80 :na, title="OverBought", linestyle=hline.style_dotted, linewidth=2)
hline(showNormal or showSmoothed ? 20 :na, title="OverSold", linestyle=hline.style_dotted, linewidth=2)
////////////////show normal

plot(showNormal? MA1 : na , linewidth=2, color=color.white)

var int colortoken=1

color1= color.green
color2 = color.yellow
color3 = color.orange
color4 = color.red

if rsiValue1>rsiValue1[1] and colortoken!=1
    colortoken:= colortoken[1] - 1

if rsiValue1<rsiValue1[1] and colortoken!=4
    colortoken:= colortoken[1] + 1

lineColor= colortoken == 1 ? color1: colortoken ==2 ? color2 : colortoken == 3 ? color3 : colortoken == 4 ? color4 :na

plot(showNormal? rsiValue1 : na, title="RSI", linewidth=3, color=lineColor)


////////////show smoothed
lensig = input.int(14, title="ADX Smoothing", minval=1, maxval=50)
len = input.int(14, minval=1, title="DI Length")
up = ta.change(high)
down = -ta.change(low)
plusDM = na(up) ? na : (up > down and up > 0 ? up : 0)
minusDM = na(down) ? na : (down > up and down > 0 ? down : 0)
trur = ta.rma(ta.tr, len)
plus = fixnan(100 * ta.rma(plusDM, len) / trur)
minus = fixnan(100 * ta.rma(minusDM, len) / trur)
sum = plus + minus
adx = 100 * ta.rma(math.abs(plus - minus) / (sum == 0 ? 1 : sum), lensig)
rsisrc = ta.rsi(close,lenrsismodiv)
adxthreshold=input.int(title="adx",defval=15)
smoothColor= adx>adxthreshold and plus>minus? color.green:adx>adxthreshold and plus<minus?color.red : adx<adxthreshold?color.gray:na

rsismma = 0.0
rsismma := na(rsismma[1]) ? ta.sma(rsisrc, lenrsissmoma) : (rsismma[1] * (lenrsissmoma - 1) + rsisrc) / lenrsissmoma
rsiwsmma= ta.wma(rsismma,lenrsissmoma)
plot(showSmoothed ? rsisrc:na, linewidth=2, color=smoothColor)
plot(showSmoothed ? rsiwsmma:na, linewidth=2, color=color.white)


////////////////RSI momentum
///////////////////// normal RSI
rsiValue2 = ta.rsi(ohlc4,lenrsimomdiv)
rsiema = ta.wma(rsiValue2,rsimommalen)
normalizedRSI= (rsiValue2-50)/100

/////////////////// Normal Momentum
lenmom = input.int(5, minval=1, title=" MOM Length",group= "RSI Momentum")
srcmom = ohlc4
mom = srcmom - srcmom[lenmom]

//////////stochRSI K line
smoothK = input.int(5, "K", minval=1)
lengthRSI = input.int(5, "RSI Length", minval=1, group="RSI Momentum")
lengthStoch = input.int(34, "Stochastic Length", minval=1,group= "RSI Momentum")
src = input(ohlc4, title="RSI Source",group= "RSI Momentum")
rsi1 = ta.rsi(src, lengthRSI)
k = ((ta.sma(ta.stoch(rsi1, rsi1, rsi1, lengthStoch), smoothK))-50)/100

WTF=math.avg(mom,normalizedRSI,k)
smmaLen = input.int(25, minval=1, title="SMMA Length", group = "RSI Momentum")
smmaLen1= 2
smmaSrc = WTF
WTFsmma = 0.0
WTFsmma := na(WTFsmma[1]) ? ta.sma(smmaSrc, smmaLen1) : (WTFsmma[1] * (smmaLen1 - 1) + smmaSrc) / smmaLen1
smma = 0.0
smma := na(smma[1]) ? ta.sma(smmaSrc, smmaLen) : (smma[1] * (smmaLen - 1) + smmaSrc) / smmaLen


color1a= #0E3F01
color2a = #31FA2A
color3a = #FA6B6B
color4a = #971643

momentumColor= WTF>WTF[1] and WTF>smma ? color1a : WTF<WTF[1] and WTF>smma ? color2a : WTF>WTF[1] and WTF<smma ? color3a : WTF<WTF[1] and WTF<smma ? color4a : na


plot(showMomentum ? WTF:na, color=momentumColor, linewidth=3)
plot(showMomentum ? smma:na , linewidth=2, color=color.white)


osc= displayRSI =="RSI Divergence" ? rsiValue1 : displayRSI =="RSI Smoothed" ? rsisrc:na

///////////divergence
plFound = na(ta.pivotlow(osc, lbL, lbR)) ? false : true
phFound = na(ta.pivothigh(osc, lbL, lbR)) ? false : true
_inRange(cond) =>
	bars = ta.barssince(cond == true)
	rangeLower <= bars and bars <= rangeUpper

//------------------------------------------------------------------------------
// Regular Bullish
// Osc: Higher Low

oscHL = osc[lbR] > ta.valuewhen(plFound, osc[lbR], 1) and _inRange(plFound[1])

// Price: Lower Low

priceLL = low[lbR] < ta.valuewhen(plFound, low[lbR], 1)
bullCond = plotBull and priceLL and oscHL and plFound

plot(
     displayRSI !="RSI Momentum"and plFound ? osc[lbR] : na,
     offset=-lbR,
     title="Regular Bullish",
     linewidth=2,
     color=(bullCond ? bullColorrsidiv : noneColor)

     )


//------------------------------------------------------------------------------
// Hidden Bullish
// Osc: Lower Low

oscLL = osc[lbR] < ta.valuewhen(plFound, osc[lbR], 1) and _inRange(plFound[1])

// Price: Higher Low

priceHL = low[lbR] > ta.valuewhen(plFound, low[lbR], 1)
hiddenBullCond = plotHiddenBull and priceHL and oscLL and plFound

plot(
	 displayRSI !="RSI Momentum" and plFound ? osc[lbR] : na,
	 offset=-lbR,
	 title="Hidden Bullish",
	 linewidth=2,
	 color=(hiddenBullCond ? hiddenBullColor : noneColor)

	 )


//------------------------------------------------------------------------------
// Regular Bearish
// Osc: Lower High

oscLH = osc[lbR] < ta.valuewhen(phFound, osc[lbR], 1) and _inRange(phFound[1])

// Price: Higher High

priceHH = high[lbR] > ta.valuewhen(phFound, high[lbR], 1)

bearCond = plotBear and priceHH and oscLH and phFound

plot(
	 displayRSI !="RSI Momentum" and phFound ? osc[lbR] : na,
	 offset=-lbR,
	 title="Regular Bearish",
	 linewidth=2,
	 color=(bearCond ? bearColorrsidiv : noneColor)

	 )


//------------------------------------------------------------------------------
// Hidden Bearish
// Osc: Higher High

oscHH = osc[lbR] > ta.valuewhen(phFound, osc[lbR], 1) and _inRange(phFound[1])

// Price: Lower High

priceLH = high[lbR] < ta.valuewhen(phFound, high[lbR], 1)

hiddenBearCond = plotHiddenBear and priceLH and oscHH and phFound

plot(
	 displayRSI !="RSI Momentum" and phFound ? osc[lbR] : na,
	 offset=-lbR,
	 title="Hidden Bearish",
	 linewidth=2,
	 color=(hiddenBearCond ? hiddenBearColor : noneColor)

	 )


// ### Alerts


if bearCond
    alert("Bearish Divergence")
else if hiddenBearCond
    alert("Hidden Bearish Divergence")
else if bullCond
    alert("Bullish Divergence")
else if hiddenBullCond
    alert("Hidden Bullish Divergence")

if hiddenBullCond
    strategy.entry("Enter Long", strategy.long)
else if hiddenBearCond
    strategy.entry("Enter Short", strategy.short)


// END ###
- MACD RSI 이치모쿠 모멘텀 트렌드
- RSI 방향 변경 전략
- 향상된 볼링거 밴드 RSI 거래 전략
- 중추 및 동력 전략
- 이동 평균 및 RSI 종합 거래 전략
- 토요일 전환 전략 (주말 필터)
- RSI/MACD/ATR과 함께 강화된 EMA 크로스오버 전략
- MACD와 RSI 결합된 장기 거래 전략
- RSI2 전략 내일 반전 승률 역시험
- 전략에 따른 다중 지표 트렌드
- AlphaTradingBot 거래 전략
- MA 하이브리드 BY RAJ
- 다이아몬드 트렌드
- 니크 스톡
- 스톡 슈퍼트르드 ATR 200ma
- MTF RSI & STOCH 전략
- EMA + AROON + ASH
- 모멘텀 2.0
- EHMA 범위 전략
- 이동 평균 구매 판매
- 미다스 Mk. II - 최고의 암호화 스윙
- TV의 높고 낮은 전략
- 가장 좋은 트레이딩 뷰 전략
- 빅 스냅퍼 경고 R3.0 + Chaiking 변동성 상태 + TP RSI
데 크롤 스톱 - CCI + EMA와 RSI 크로스 전략
- EMA 대역 + leledc + Bollinger 대역 트렌드 포스팅 전략
- RSI MTF Ob+Os
- MACD 위일리 전략
- RSI - 구매 판매 신호
- 하이킨-아시 추세