트레일링 브레이크아웃 전략

개요
이 전략은 주로 <unk>唐<unk>通道<unk>指標를 통해 추적형의 돌파 거래 전략을 구현한다. 이 전략은 추세와 돌파 두 가지 거래 사고방식을 결합하고, 긴 선의 추세 판단에 기초하여, 짧은 주기의 돌파점을 찾아 엔트리를 수행하고, 트렌드 상황에서의 순진 거래를 실현한다. 또한, 전략은 각 거래의 위험 수익률을 제어하기 위해 중지 손실 및 중지 수준을 설정한다.
전략 원칙
-
<unk>唐<unk>通道<unk> 지표의 매개 변수, 기본 주기 20;
-
EMA 평평한 이동 평균선, 기본 주기 200;
-
리스크/수익비율이 1.5로 설정됩니다.
-
돌파 후퇴 파라미터를 다중 헤드 및 빈 헤드로 설정합니다.
-
그 기록은 어떤 지점으로 기록되었는지,
-
멀티 헤드 신호: 이전 돌파구가 낮은 지점이고 가격이 둥지안 상반도와 EMA 평균선보다 높으면 멀티 헤드 신호를 생성합니다.
-
허공 신호: 이전 돌파구가 높은 지점이고 가격이 둥지안 하단 궤도와 EMA 평균선 이하인 경우 허공 신호를 생성한다.
-
다중 상점 포지션에 들어가면, 정지 손실을 둥지안 하계 철회 5점으로 설정하고, 정지 손실을 위험-수익 비율 곱하기 정지 거리로 설정합니다.
-
공허 포지션에 들어간 후, 정지 손실은 둥천 상철 철회 5점으로 설정하고, 정지는 위험 수익 비율 곱하기 정지 손실 거리를 <unk>다.
이 방법으로, 전략은 추세 판단과 돌파구 조작을 결합하여, 순차적으로, 긴 선의 추세에서 더 짧은 기간의 기회를 잡을 수 있습니다. 동시에, 손실을 막는 설치는 단일 거래의 위험 수익 상황을 제어 할 수 있습니다.
우위 분석
-
긴 트렌드를 추적하고, 역동적인 거래를 피하기 위해 계속 노력하십시오.
-
동치안 통로가 긴 선의 지표로서, EMA 평선 필터와 결합하여 트렌드 방향을 더 잘 판단할 수 있다.
-
손해 막기 장치는 각 위험을 제어하여 가능한 손실을 제한합니다.
-
위험과 이익의 비율을 최적화하여 손실과 손실의 비율을 높여 초과 수익을 추구하십시오.
-
리포트 파라미터를 유연하게 설정하여 다른 시장에 맞는 최적의 파라미터 조합을 조정할 수 있다.
위험 분석
-
둥치안 통로와 EMA 평행선이 필터링 지표로 사용되어 잘못된 신호가 발생할 수 있습니다.
-
브레이크 트레이드는 쉽게 잡힐 수 있고, 트렌드 배경을 명확하게 파악하는 것이 필요합니다.
-
스톱 로즈 스톱 <unk> 거리는 고정되어 있으며, 시장의 변동에 따라 조정할 수 없습니다.
-
Parameters 최적화 공간은 제한되어 있고, 실디 디스크 효과는 보장되지 않는다.
-
거래 시스템은 너무 많은 무작위적 사건들을 견딜 수 없고, 블랙 스완 사건은 큰 손실을 초래할 수 있다.
최적화 방향
-
더 많은 지표를 추가하여 필터링을 고려할 수 있습니다. 예를 들어, 진동 지표, 신호 품질을 향상시킵니다.
-
스마트 스톱로스 스톱을 설정하여 시장의 변동과 ATR 지표의 동력에 따라 손실 위치를 조정할 수 있습니다.
-
기계 학습과 같은 방법을 사용하여 실제 시장에 더 가깝게 테스트 및 최적화 할 수 있습니다.
-
출전 논리를 최적화하여 VOLUME 또는 변동률 지표를 보조 조건으로 설정하여 함정을 피할 수 있습니다.
-
트렌드 추적 전략이나 기계 학습과 결합하여 혼합 전략을 형성하여 안정성을 향상시킬 수 있습니다.
요약하다
이 전략은 추적형 돌파 전략으로서, 핵심 아이디어는 긴 선의 추세를 판단한 전제 하에 돌파를 신호로 삼고, 단편 거래 위험을 제어하기 위한 스톱 로즈 스<unk>을 설정하는 것이다. 이 전략은 장점이 있지만, 또한 최적화 할 수 있는 공간이 있다.
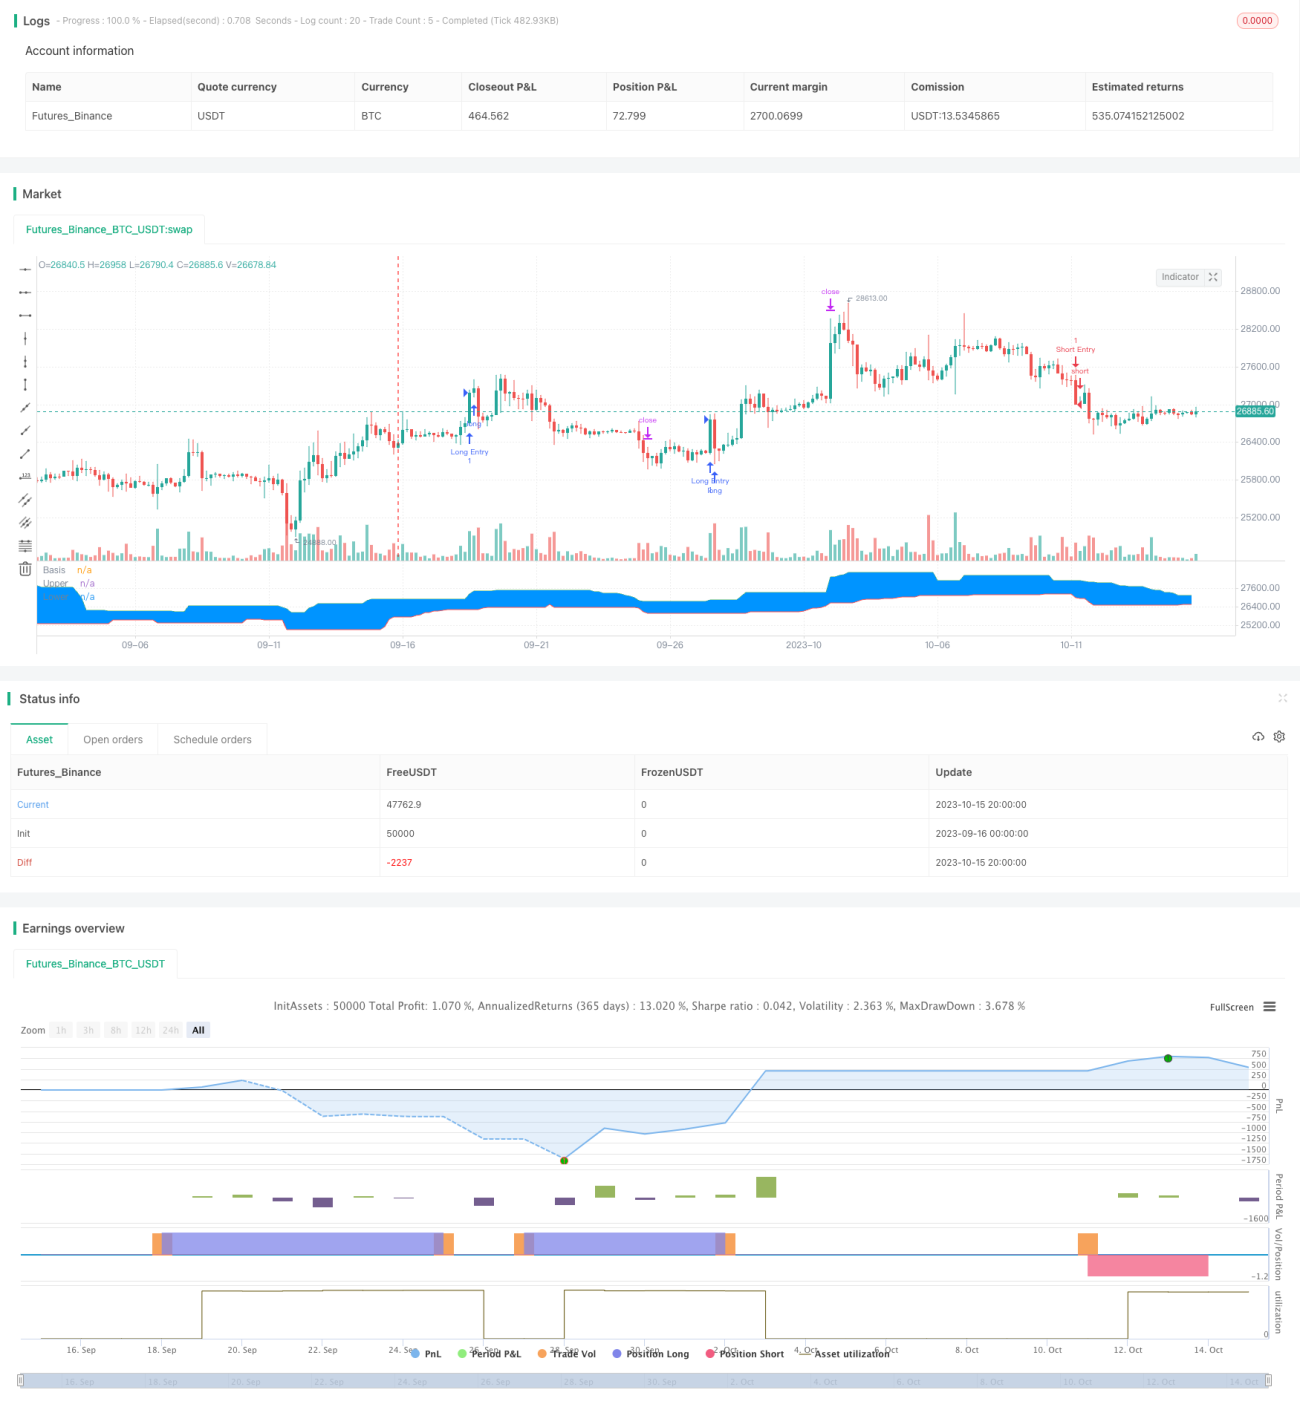
/*backtest
start: 2023-09-16 00:00:00
end: 2023-10-16 00:00:00
period: 4h
basePeriod: 15m
exchanges: [{"eid":"Futures_Binance","currency":"BTC_USDT"}]
*/

//@version=4
// Welcome to my second script on Tradingview with Pinescript
// First of, I'm sorry for the amount of comments on this script, this script was a challenge for me, fun one for sure, but I wanted to thoroughly go through every step before making the script public
// Glad I did so because I fixed some weird things and I ended up forgetting to add the EMA into the equation so our entry signals were a mess- 1