
개요
이 전략은 주로 이동 평균의 법칙을 사용하여, 주식의 단기적 인 추락 이후의 반발 기회를 찾습니다. 빠른 이동 평균이 느린 이동 평균 아래에있을 때, 주식은 하향 추세에 있음을 나타냅니다. 빠른 이동 평균의 일정 정도를 넘어선 후에 다시 떨어지는 공간이 제한되어, 가격이 다시 올라갈 수 있다면 빠른 이동 평균을 뚫고 주식의 하향 추세가 끝났음을 나타냅니다. 반발이 발생합니다.
전략 원칙
-
빠른 이동 평균 EMA (예: 8 일 선) 과 느린 이동 평균 SMA (예: 20 일 선) 을 설정한다.
-
SMA가 EMA 위에 있을 때, 지표는 상승 추세에 있다. SMA가 EMA 아래에 있을 때, 지표는 하락 추세에 있다.
-
가격이 EMA의 일정 범위를 (예: 2-10%) 넘어서면, 주식이 초하락 영역에 들어서면, 반발 가능성이 높다.
-
가격 상승이 EMA를 넘어서면 구매 신호입니다.
-
스톱 라인은 EMA 근처에, 스톱 라인은 중간 느린 이동 평균 SMA (예: 50 일 라인) 근처에, 또는 일정 비율로 스톱 라인을 설정한다.
-
가격이 EMA를 다시 넘어갈 때, 청산 손실.
전략적 이점
-
이동 평균의 법칙을 이용해서 비교적 신뢰할 수 있습니다.
-
빠른 이동 평균과 오버박스 조건으로 오버박스의 반발을 결정하는 확률을 높일 수 있다.
-
Stop Loss 및 Stop Stop 조건을 구성하여 위험을 제어할 수 있습니다.
-
다양한 위험 선호에 맞는 유연한 포지션 비율을 설정할 수 있다.
전략적 위험
-
하지만, 이 경우에도 반발이 실패할 확률이 존재합니다.
-
이동 평균 자체는 지연성이 강하여 지역 반동에 빠질 수 있습니다.
-
파동이 큰 경우 쉽게 타격될 수 있는 빠른 이동 평균에 가까운 파동지점.
-
일부 파라미터는 수동으로 구성해야 하며, 다른 파라미터는 결과에 큰 영향을 미칩니다.
-
이 결과는 주식 선택에 큰 영향을 미칩니다.
전략 최적화 방향
-
트렌드를 판단하는 지표를 늘리고 역동적인 조작을 피한다.
-
거래량과 같은 지표 필터링을 추가하여 성공 확률을 높여줍니다.
-
스톱 피해는 동적 추적을 고려하여 스톱 피해가 <unk> 확률을 줄일 수 있다.
-
최적의 변수 조합을 연구하여 변수 의존성을 줄일 수 있다.
-
주식 선택 조건과 결합하여 주식 선택 효과를 높일 수 있습니다.
요약하다
이 전략의 전체적인 아이디어는 명확하고 이해하기 쉽고, 이동 평균 반전 거래 전략의 전형적인 대표적이다. 장점은 상대적으로 안정적이며, 위험을 제어할 수 있으며, 초보자에게 적합하다. 그러나 또한 일정 확률에 반전점을 올바르게 판단할 수 없는 문제가 있다. 다른 지표, 동적 중지 손실, 매개 변수 최적화 등의 수단과 결합하여 개선할 수 있으며, 전략의 안정성을 향상시킬 수 있다.
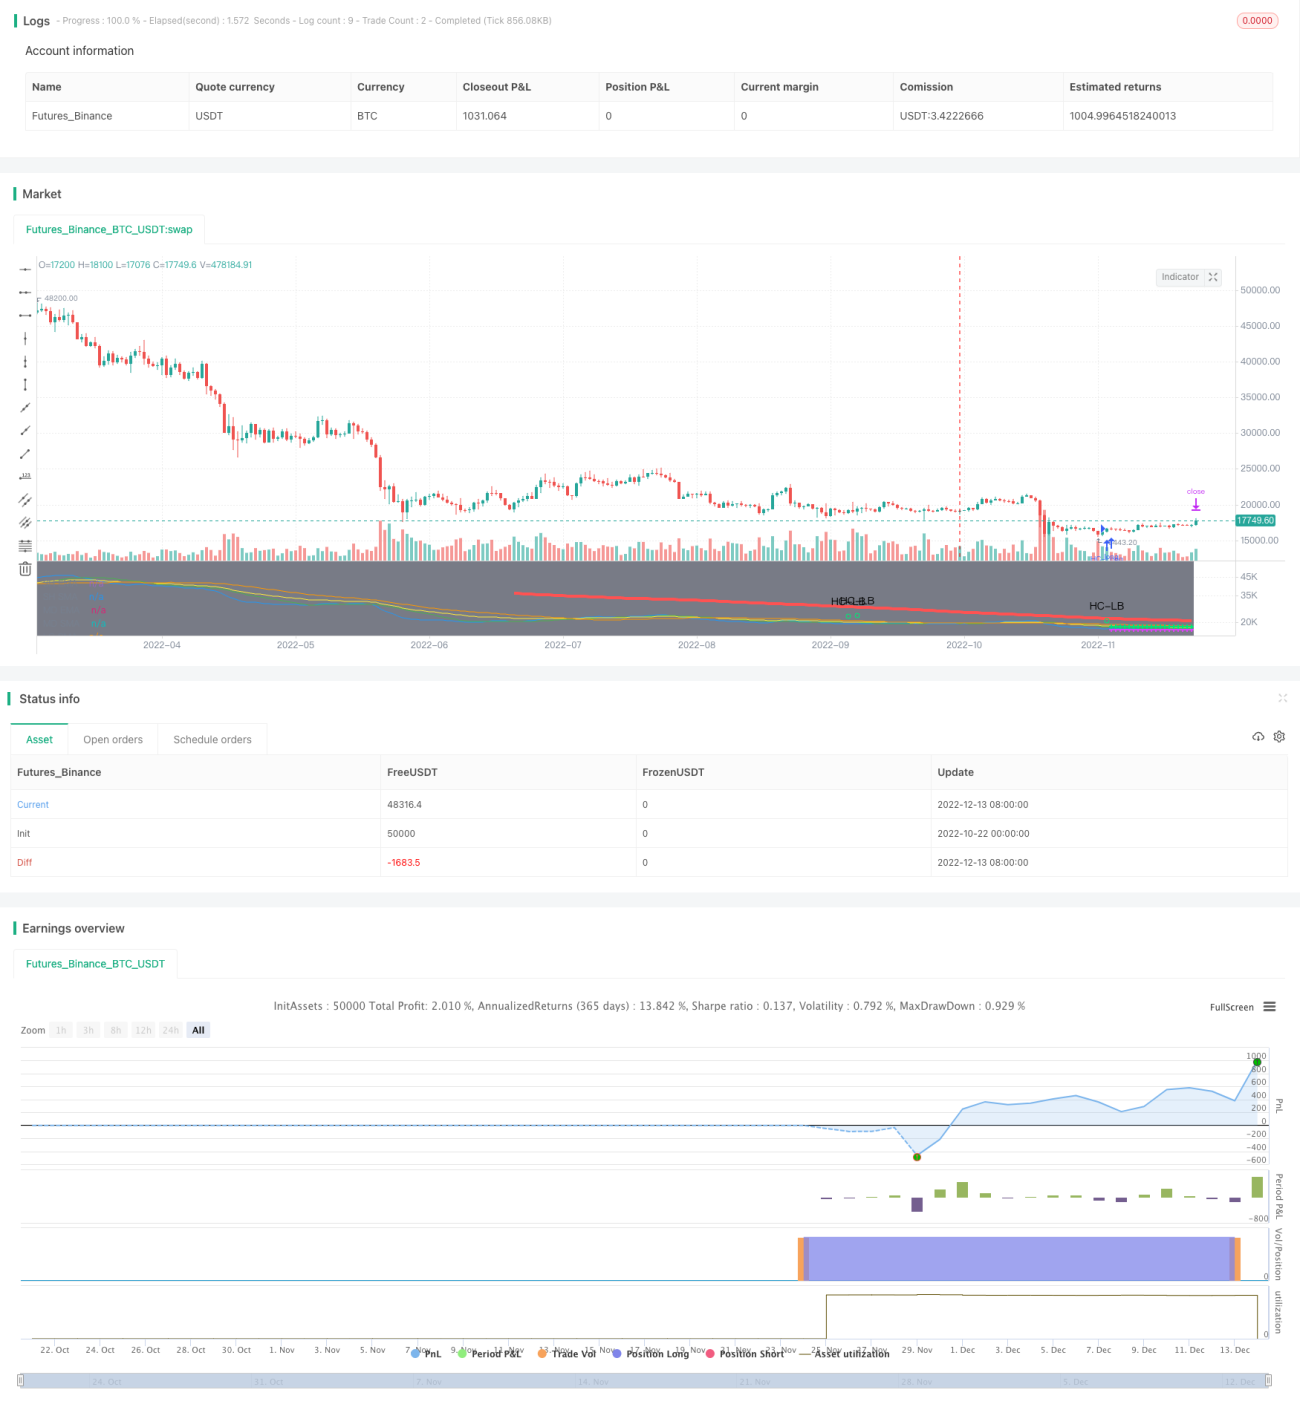
/*backtest
start: 2022-10-22 00:00:00
end: 2022-12-14 00:00:00
period: 1d
basePeriod: 1h
exchanges: [{"eid":"Futures_Binance","currency":"BTC_USDT"}]
*/

//@version=4

// This source code is subject to the terms of the Mozilla Public License 2.0 at https://mozilla.org/MPL/2.0/
// © MakeMoneyCoESTB2020- 1