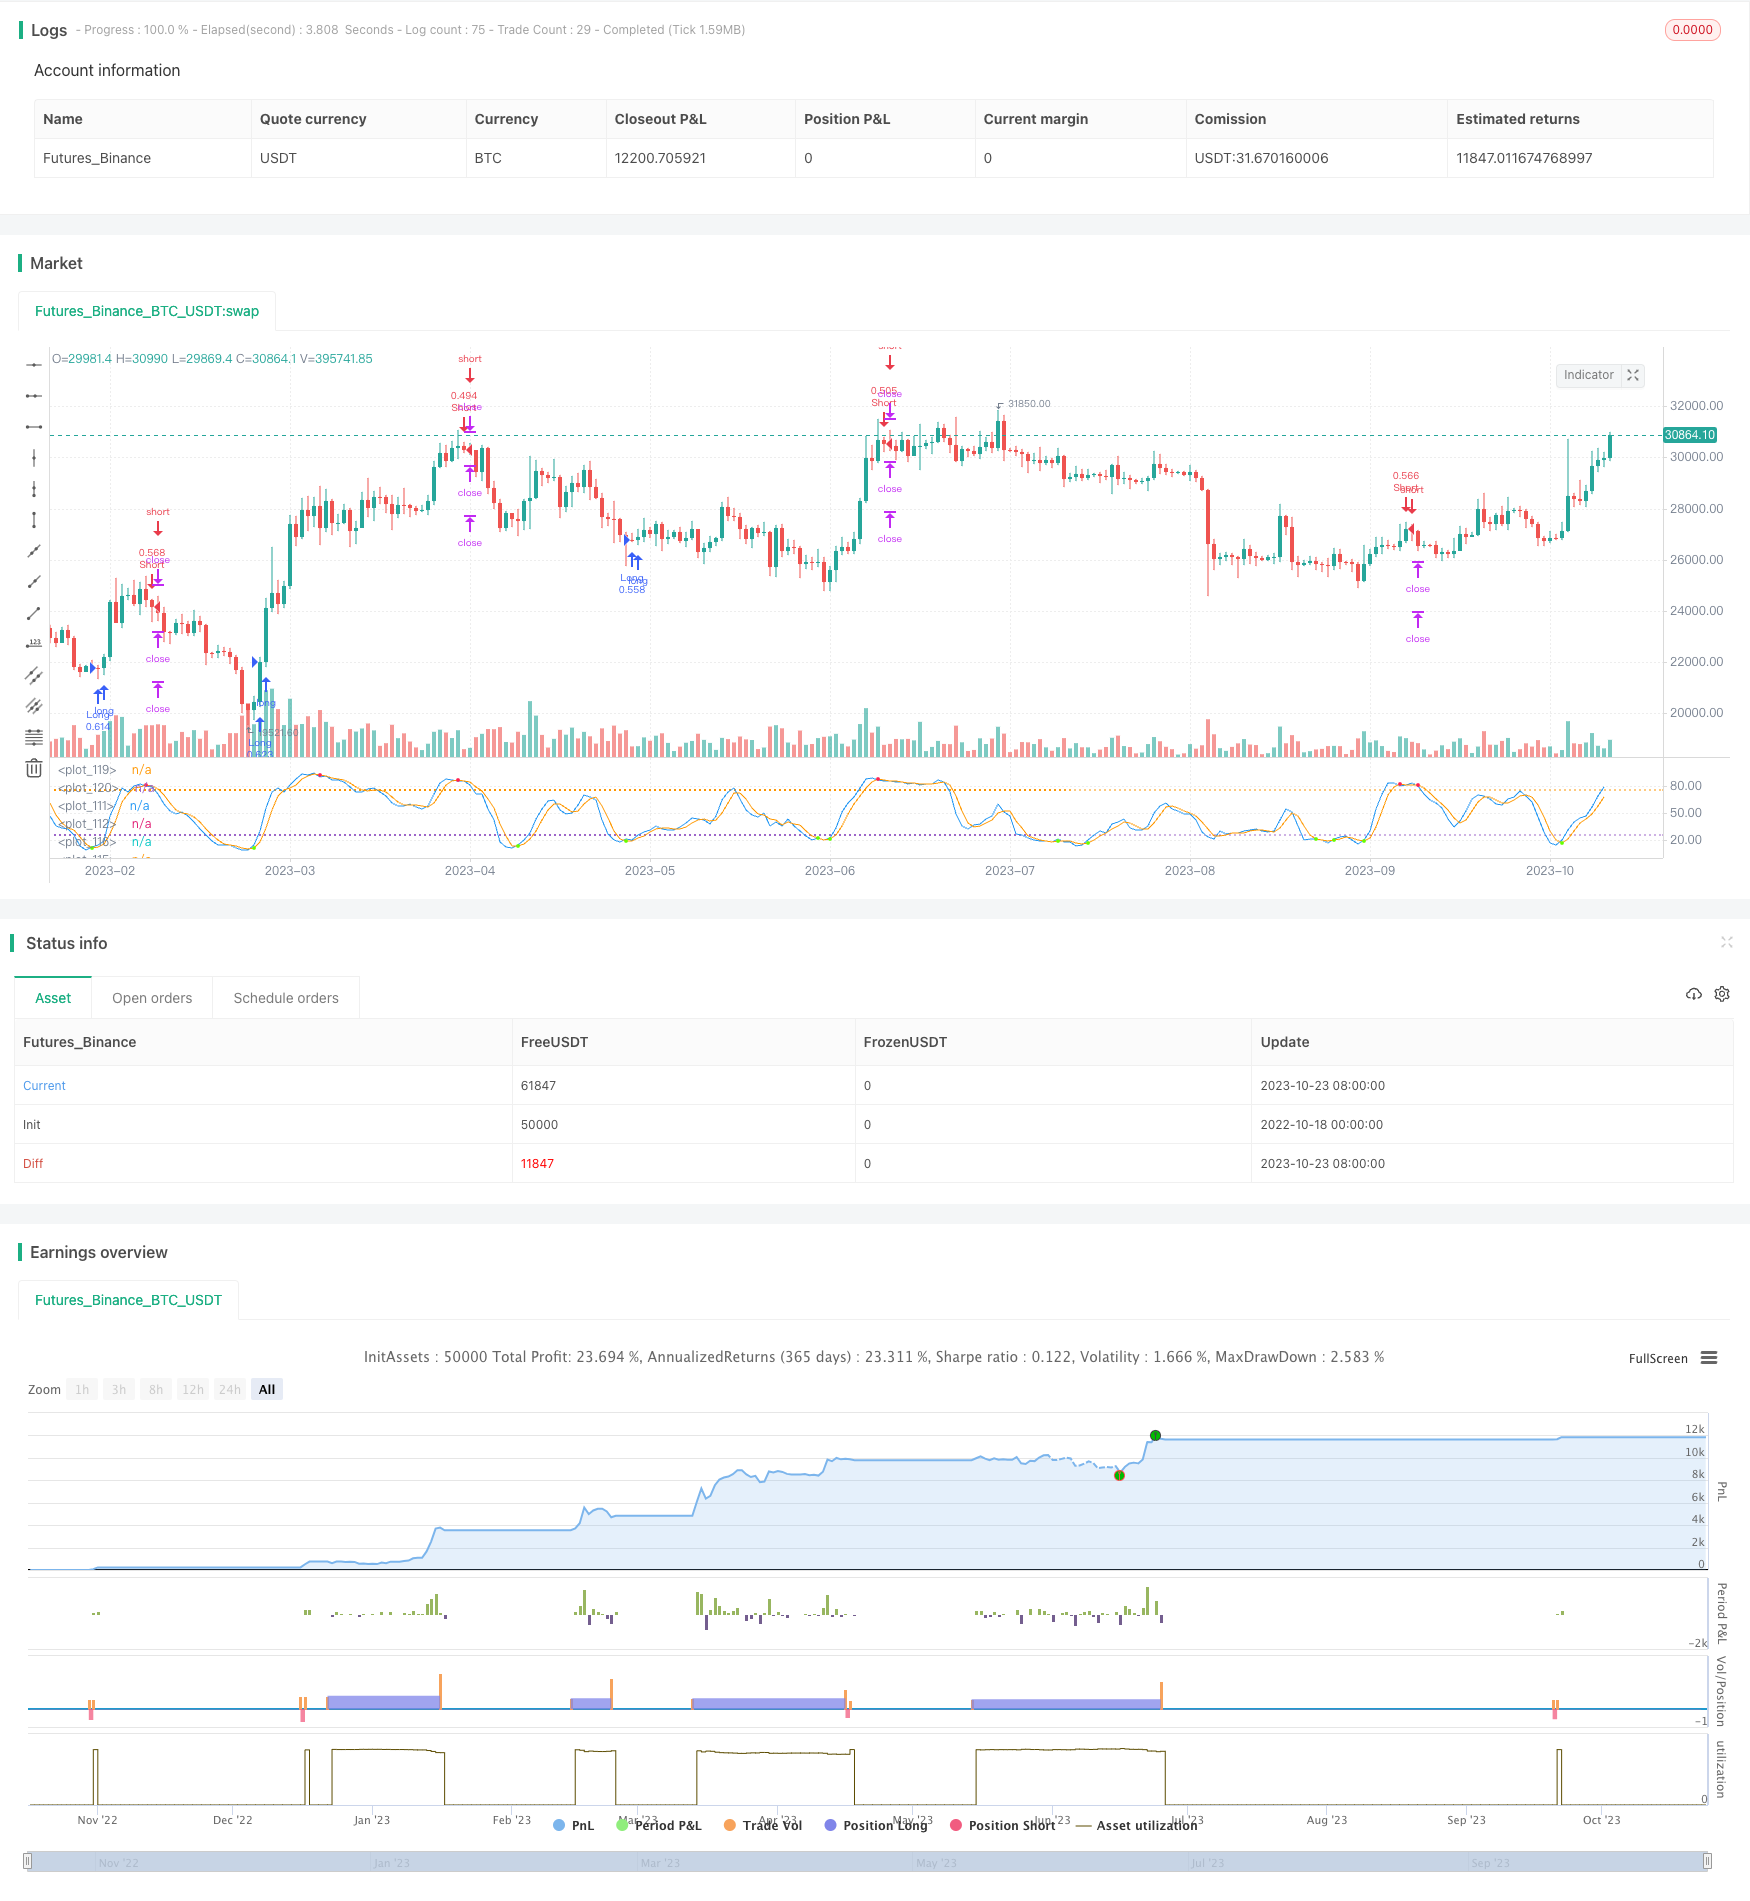
개요
이 전략의 주요 아이디어는 두 개의 스톱포트를 설정하고, 첫 번째 스톱포트가 트리거되면 스톱포트를 입시 가격으로 이동시켜 스톱포트가 아지는 것을 방지하는 것이다.
전략 원칙
이 전략은 브린 띠와 스토카스틱 지표의 진입을 기반으로 한다. 가격이 브린 띠를 초과할 때 공백을 하고, 스토카스틱 지표가 초과할 때 더 한다.
이 전략의 입시 논리는 다음과 같습니다.
부린의 하단에서 닫힌 가격과 Stochastic K의 하단에서 D선을 통과할 때 더 많은 입구
부린 반지보다 높은 마감 가격과 Stochastic K 선이 D 선을 통과 할 때 공백 입구
이 전략은 두 개의 스톱포인트를 설정합니다. 첫 번째 스톱포인트는 200 포인트, 두 번째 스톱포인트는 500 포인트로 고정됩니다.
가격 이동 과정에서 첫 번째 정지점이 촉발되면, 이 전략은 정지점을 입시 가격으로 이동시킨다. 이렇게하면 첫 번째 단계의 이익을 잠금화할 수 있으며, 동시에 정지 손실이 가격 변동의 가장자리에 놓여지는 것을 방지한다.
두 번째 스톱포인트가 트리플되거나 스톱로즈가 트리플되면 이 전략은 완전히 청산된다.
전략적 이점
이 두 단계의 중지 전략의 가장 큰 장점은 수익을 잠금 할 수 있다는 것입니다. 동시에 중지되는 것이 가격 변동에 의해 좌우되는 것을 방지 할 수 있습니다. 입시 가격으로 중지 지점을 이동함으로써 중지되는 것이 좌우되는 가능성을 줄여 이익을 보호 할 수 있습니다.
또 다른 장점은 이 전략은 가격 변동의 범위를 판단하는 브린 밴드 지표와 과매매를 판단하는 스토카스틱 지표의 조합 전략을 채택한다는 것입니다. 이 두 지표는 상호 보완하여 입시의 정확도를 향상시킬 수 있습니다.
전략적 위험
이 전략의 주요 위험은 부린 밴드 지표와 스토카스틱 지표가 모두 잘못된 신호를 일으킬 수 있다는 것이다. 부린 밴드 범위 계산이 잘못되면 잘못된 진출 시기가 발생하거나 잘못된 신호가 발생한다. 스토카스틱 지표가 가짜 돌파를 일으킨다면 잘못된 진출도 발생할 수 있다.
또한, 입시 가격으로 이동한 스톱로스는 또 다시 우회될 위험이 있다. V형 역전 시, 스톱로스는 두 번째 트리거가 될 가능성이 있다.
이러한 위험을 줄이기 위해, 브린 대역을 조정할 수 있으며, 스토카스틱 지표의 파라미터 조합을 최적화하고, 스톱포트 간격을 적절히 높일 수 있다.
전략 최적화 방향
이 두 단계의 손해 중지 전략은 더욱 개선될 수 있습니다.
다른 변수 조합을 테스트하고, 브린 밴드 변수와 스토캐스틱 변수를 최적화하여 최적의 변수 조합을 찾을 수 있다.
다양한 스톱 스톱 패스 설정을 테스트하여 스톱 스톱 패스 크기를 최적화하여 최적의 구성을 찾을 수 있습니다.
이동 평균 등과 같은 다른 지표가 추가될 수 있으며, 진출률을 높이기 위해 다중 지표 조합 전략을 형성한다.
다른 스톱포트 이동 논리를 연구할 수 있다. 예를 들어, 입시 가격보다는 일정 간격으로 이동한다.
스톱포트 이동 횟수를 늘려 3단계 이상의 스톱포트 이동을 설정할 수 있다.
요약하다
이 전략은 브린 밴드 지표와 스토카스틱 지표를 사용하여 입시 시기를 판단하고, 두 개의 정지점을 설정하고, 첫 번째 정지점이 도달한 후 입시 가격으로의 중지 지점을 이동하여, 두 단계의 중지 전략을 형성한다. 이 전략은 수익을 효과적으로 잠금하고, 중지되는 손실을 방지할 수 있다. 전략의 장점은 눈에 띄지만, 개선할 여지가 있다.
/*backtest
start: 2022-10-18 00:00:00
end: 2023-10-24 00:00:00
period: 1d
basePeriod: 1h
exchanges: [{"eid":"Futures_Binance","currency":"BTC_USDT"}]
*/

// This source code is subject to the terms of the Mozilla Public License 2.0 at https://mozilla.org/MPL/2.0/
// © fpsd4ve

//@version=5

// Add Bollinger Bands indicator (close, 20, 2) manually to visualise trading conditions
strategy("2xTP, SL to entry",
     overlay=false,
     pyramiding=0,
     calc_on_every_tick=false,
     default_qty_type=strategy.percent_of_equity,
     default_qty_value=25,
     initial_capital=1000,
     commission_type=strategy.commission.percent,
     commission_value=0.01
     )

// PARAMETERS
// Assumes quote currency is FIAT as with BTC/USDT pair
tp1=input.float(200, title="Take Profit 1")
tp2=input.float(500, title="Take Profit 2")
sl=input.float(200, title="Stop Loss")
stOBOS = input.bool(true, title="Use Stochastic overbought/oversold threshold")

// Colors
colorRed = #FF2052
colorGreen = #66FF00


// FUNCTIONS
// Stochastic
f_stochastic() =>
    stoch = ta.stoch(close, high, low, 14)
    stoch_K = ta.sma(stoch, 3)
    stoch_D = ta.sma(stoch_K, 3)
    stRD = ta.crossunder(stoch_K, stoch_D)
    stGD = ta.crossover(stoch_K, stoch_D)
    [stoch_K, stoch_D, stRD, stGD]


// VARIABLES
[bbMiddle, bbUpper, bbLower] = ta.bb(close, 20, 2)
[stoch_K, stoch_D, stRD, stGD] = f_stochastic()


// ORDERS
// Active Orders
// Check if strategy has open positions
inLong = strategy.position_size > 0
inShort = strategy.position_size < 0
// Check if strategy reduced position size in last bar
longClose = strategy.position_size < strategy.position_size[1]
shortClose = strategy.position_size > strategy.position_size[1]

// Entry Conditions
// Enter long when during last candle these conditions are true:
// Candle high is greater than upper Bollinger Band
// Stochastic K line crosses under D line and is oversold
longCondition = stOBOS ?
     low[1] < bbLower[1] and stGD[1] and stoch_K[1] < 25 :
     low[1] < bbLower[1] and stGD[1]

// Enter short when during last candle these conditions are true:
// Candle low is lower than lower Bollinger Band
// Stochastic K line crosses over D line and is overbought
shortCondition = stOBOS ?
     high[1] > bbUpper[1] and stRD[1] and stoch_K[1] > 75 :
     high[1] > bbUpper[1] and stRD[1]

// Exit Conditions
// Calculate Take Profit
longTP1 = strategy.position_avg_price + tp1
longTP2 = strategy.position_avg_price + tp2
shortTP1 = strategy.position_avg_price - tp1
shortTP2 = strategy.position_avg_price - tp2

// Calculate Stop Loss
// Initialise variables
var float longSL = 0.0
var float shortSL = 0.0

// When not in position, set stop loss using close price which is the price used during backtesting
// When in a position, check to see if the position was reduced on the last bar
// If it was, set stop loss to position entry price. Otherwise, maintain last stop loss value
longSL := if inLong and ta.barssince(longClose) < ta.barssince(longCondition)
    strategy.position_avg_price
else if inLong
    longSL[1]
else
    close - sl

shortSL := if inShort and ta.barssince(shortClose) < ta.barssince(shortCondition)
    strategy.position_avg_price
else if inShort
    shortSL[1]
else
    close + sl

// Manage positions
strategy.entry("Long", strategy.long, when=longCondition)
strategy.exit("TP1/SL", from_entry="Long", qty_percent=50, limit=longTP1, stop=longSL)
strategy.exit("TP2/SL", from_entry="Long", limit=longTP2, stop=longSL)

strategy.entry("Short", strategy.short, when=shortCondition)
strategy.exit("TP1/SL", from_entry="Short", qty_percent=50, limit=shortTP1, stop=shortSL)
strategy.exit("TP2/SL", from_entry="Short", limit=shortTP2, stop=shortSL)


// DRAW
// Stochastic Chart
plot(stoch_K, color=color.blue)
plot(stoch_D, color=color.orange)

// Circles
plot(stOBOS ? stRD and stoch_K >= 75 ? stoch_D : na : stRD ? stoch_D : na, color=colorRed, style=plot.style_circles, linewidth=3)
plot(stOBOS ? stGD and stoch_K <= 25 ? stoch_D : na : stGD ? stoch_K : na, color=colorGreen, style=plot.style_circles, linewidth=3)

// Levels
hline(75, linestyle=hline.style_dotted)
hline(25, linestyle=hline.style_dotted)