다중 시간대 이익 실현 전략

개요
이 전략은 다중 시간 프레임에 있는 스톱 관리를 구현하기 위한 것이다. 전략은 동시에 비율 스톱과 메인 시간 프레임 이상의 핵심 가격 영역 스톱을 적용하여 보다 정확하고 효과적인 스톱 관리를 구현한다.
전략 원칙
이 전략은 먼저 파동 트렌드 지표를 도입하여 지표 금포크에 따라 다중 신호 입구를 한다.
이 전략은 두 가지 방법으로 진행됩니다.
-
백분율 정지: 입점 가격의 일정한 비율에 따라 여러 개의 정지 가격을 설정한다.
-
다중 시간 프레임 정지점: 일선과 4시간 선에서 평균선을 그리고, 이 평균선의 가격을 정지점 가격으로 <unk>다.
퍼센티지 스톱에 대해, 전략은 4개의 다른 퍼센티지 스톱 가격을 설정한다. 가격이 각각의 스톱 가격을 만지면, 설정된 퍼센티지에 따라 부분적으로 청산된다.
다중 시간 프레임 정지시, 전략은 일선과 4 시간선에서 각각 100일 평균선, 200일 평균선을 그리는 것이다. 이 평균선들의 가격을 정지 가격으로 삼고, 가격이 정지점에 도달했을 때 평소하는 것이다.
또한, 전략은 스톱로스 가격을 설정한다. 가격이 스톱로스 가격보다 낮으면, 모든 포지션은 청산된다.
전체 전략은 백분율 정지 및 다중 시간 프레임 정지 사용의 조합을 통해 더 포괄적이고 세밀한 정지 관리를 실현합니다.
전략적 이점
-
백분율의 정제를 사용하여 고정된 비율에 따라 정제를 하여 조기 정제를 방지하거나 정제를 제대로 하지 않도록 한다.
-
다중 시간 프레임 분석을 통해 더 정확한 정지 가격을 설정하고, 정지 지점을 더 잘 선택합니다.
-
다단계 경련을 줄일 수 있는 세트별 경련을 줄일 수 있다.
-
스톱로스 가격을 설정하여 하향 위험을 효과적으로 제어하십시오.
-
%제어와 다중 시간 프레임 제어를 조합하여 제어가 더욱 포괄적이고 세밀하게 수행됩니다.
위험 분석
-
백분율 정지는 파라미터 설정에 의존하며, 만약 파라미터 설정이 잘못되면 정지는 너무 일찍 또는 너무 늦게 발생할 수 있다.
-
다중 시간 프레임 분석은 평균선 지표에 의존하며, 평균선은 다소 지연성이 있으며, 이탈이 발생할 수 있다.
-
정지 위치의 잘못된 설정은 불필요한 정지를 초래할 수 있다.
-
비율 정지 및 다중 시간 프레임 정지가 최적의 매칭을 위해 적절한 최적화 매개 변수가 필요합니다.
최적화 방향
-
더 많은 평균선 지표를 테스트할 수 있고, 더 좋은 평균선을 핵심 중단 가격으로 선택할 수 있다.
-
모델 예측 방법을 시도할 수 있으며, 가격의 중요한 영역을 스톱 가격으로 예측한다.
-
더 많은 정지 규칙을 도입할 수 있습니다. 정지 비율을 기대하거나, 정지를 이동하는 등으로 정지를 더 포괄적으로 만들 수 있습니다.
-
다양한 지분 기간에 최적의 비율을 테스트할 수 있다.
-
재검토를 통해 제지 변수를 최적화하여 전체적인 위험과 이익의 비율을 높일 수 있다.
요약하다
이 전략은 백분율 정지 및 다시간 프레임 정지 조합을 통해 유연하고 정확한 정지 관리를 구현한다. 전략은 정지점 선택이 더 우수하고, 정지가 더 포괄적이라는 장점이 있다. 또한 파라미터 설정, 정지 손실 위치 등의 문제가 있다. 후속으로 정지 파라미터를 최적화하고, 더 많은 정지 규칙을 추가하는 등의 측면에서 개선할 수 있어, 전략의 정지 시스템을 더 완성했다.
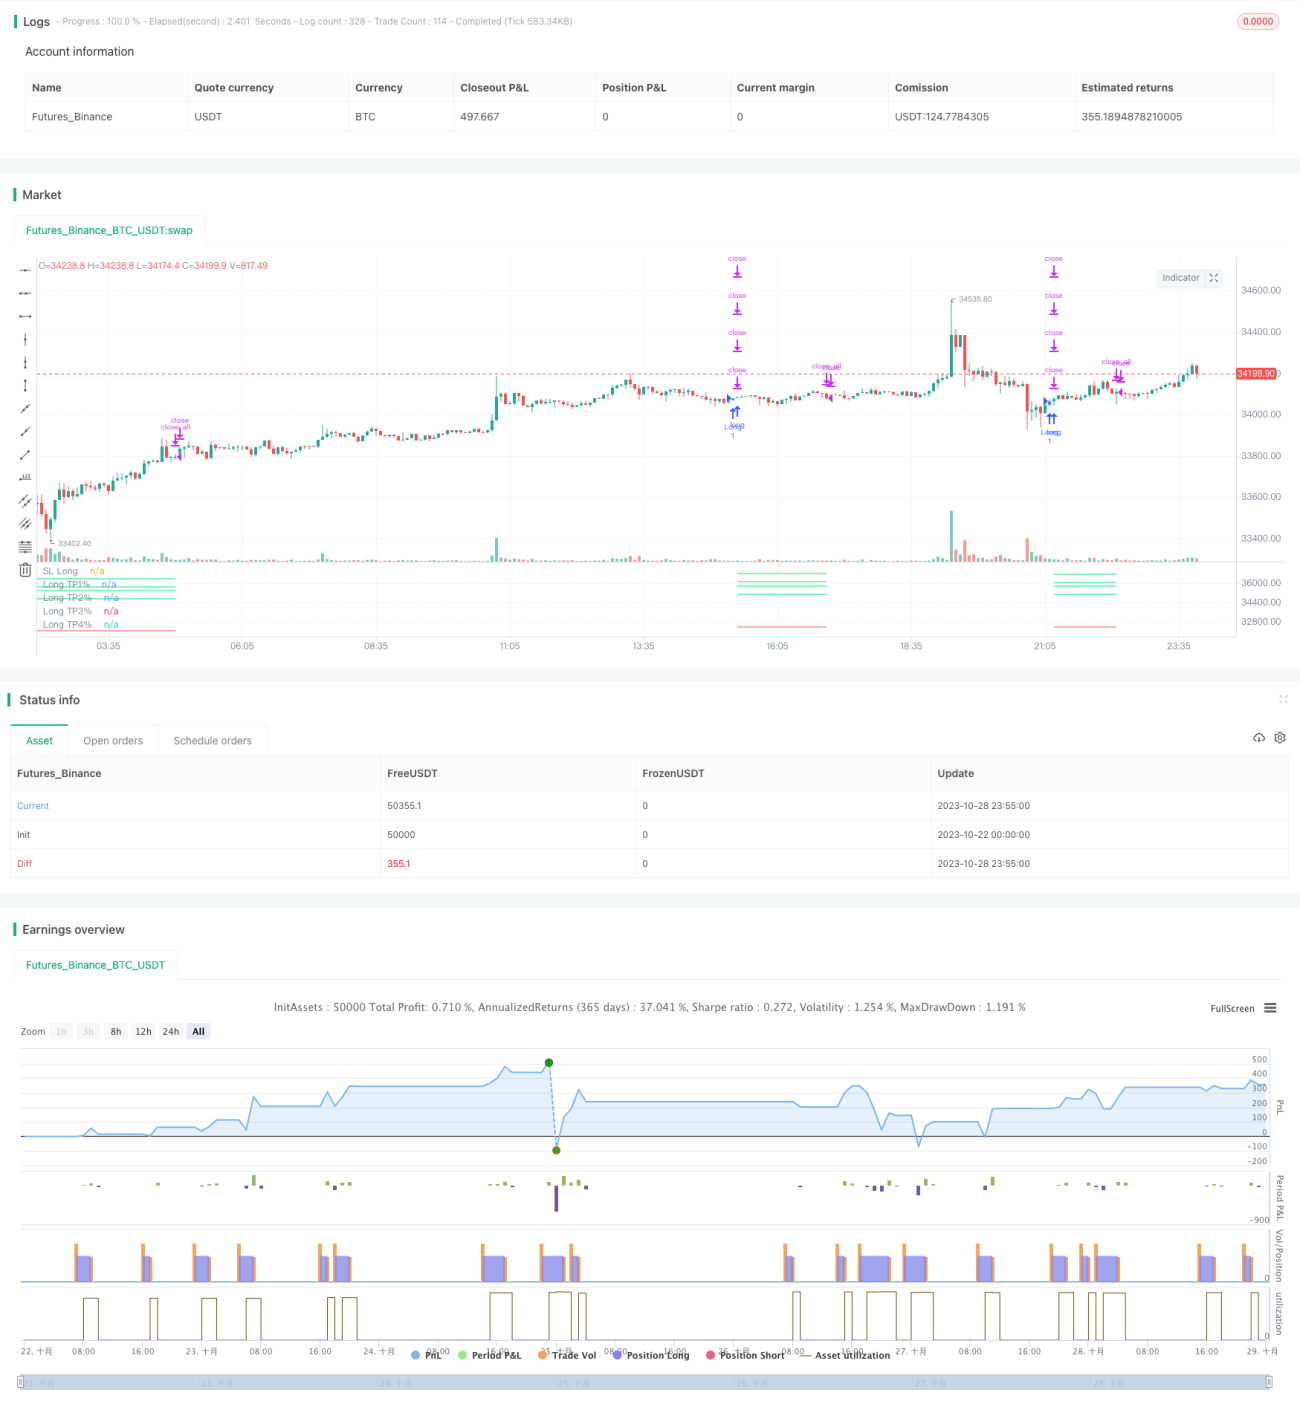
/*backtest
start: 2023-10-22 00:00:00
end: 2023-10-29 00:00:00
period: 5m
basePeriod: 1m
exchanges: [{"eid":"Futures_Binance","currency":"BTC_USDT"}]
*/

// This source code is subject to the terms of the Mozilla Public License 2.0 at https://mozilla.org/MPL/2.0/
// © TrendCrypto2022
//@version=5
// strategy("Take profit Multi timeframe", overlay=true, margin_long=100, margin_short=100)- 1