
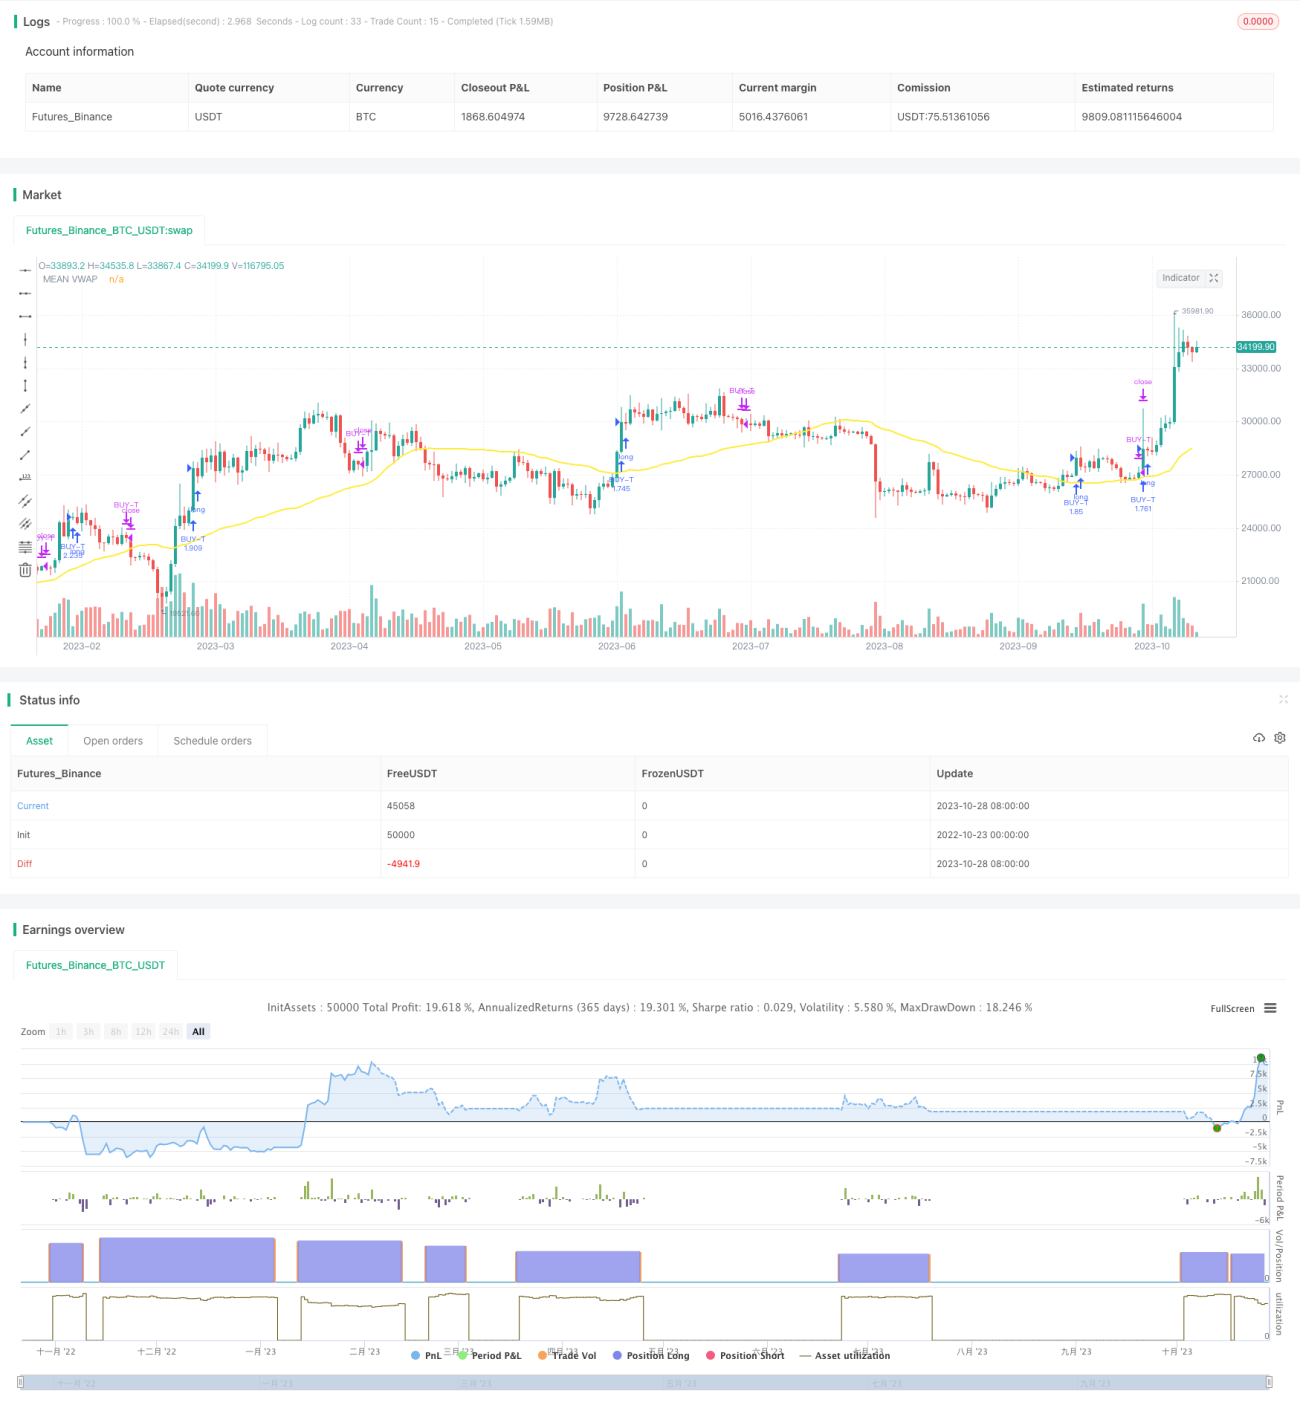
이 전략은 RSI 지표 반전 신호와 맞춤형 쌍선 추적 알고리즘을 결합하여 평행선 교차 원칙을 주로 활용하여 평행선 교차 거래를 구현합니다. 전략은 두 개의 다른 주기의 평행선 교차를 추적합니다. 빠른 평행선은 단기 트렌드를 추적하며, 다른 느린 평행선은 장기 트렌드를 추적합니다. 빠른 평행선이 느린 평행선을 상향으로 통과하면 단기 트렌드가 상향으로 표시되며, 구매할 수 있습니다.
장기 추세와 단기 추세를 나타내는 두 개의 다른 매개 변수의 VWAP 평균을 계산합니다.
두 세트의 천막선과 기준선의 평균값을 각각 느린 평균선과 빠른 평균선으로
브린 벨트 지표의 계산으로 평준화와 돌파구를 판단한다.
TSV 지수를 계산하여 거래량 에너지를 판단합니다.
RSI를 계산하여 과매매를 판단합니다.
입장 조건:
출전 조건:
이중 동선 시스템을 사용하여 장기 및 단기 동시 동시 동시 동시 동시 동시 동시 동시 동시 동시 동시 동시 동시 동시 동시 동시 동시 동시 동시 동시 동시 동시 동시 동시 동시 동시 동시 동시 동시
RSI 지표는 오버 바이 영역을 피하고, 오버 세이 영역을 판매합니다.
TSV 지표는 트렌드를 뒷받침하는 충분한 거래량을 보장합니다.
브린 벨트를 이용한 중요한 돌파구
가짜 돌파구를 효과적으로 필터링할 수 있는 다양한 지표 조합
평선 시스템은 잘못된 신호를 발생하기 쉽다. 보조 지표 필터링이 필요합니다.
RSI 지수 변수는 최적화해야 합니다. 그렇지 않으면 매도점을 놓칠 수 있습니다.
TSV 지표는 또한 변수에 민감하여 신중한 테스트가 필요합니다.
브린을 뚫고 궤도에 올리는 것은 가짜 돌파구일 가능성이 높으며, 검증이 필요합니다.
다중 지표 조합, 변수 최적화 난이도 높고, 과도하게 최적화되기 쉽다
훈련 및 테스트 데이터의 불충분으로 인해 곡선이 일치할 수 있습니다.
더 많은 주기 변수를 테스트하여 최적의 변수 조합을 찾습니다.
MACD, KD 대안 또는 RSI와 같은 다른 지표를 시도하십시오.
변수 최적화는 Walk Forward 분석을 최대한 활용합니다.
단편적 손실을 통제하기 위한 추가적인 손실 방지 전략
기계 학습 모델에 보조 신호 판단을 포함하는 것을 고려하십시오.
단일 변수 조합에 과도하게 의존하지 않고 다양한 시장에 대한 변수 조정
이 전략은 쌍평선 시스템을 통해 긴 단기 트렌드를 포착하고, RSI, TSV, 브린 밴드 등 여러 지표 필터 신호를 사용한다. 전략의 장점은 순차적으로, 장기 상승세를 포착할 수 있다는 것이다. 그러나 또한 특정 가짜 신호 위험이 존재하며, 위험을 줄이기 위해 파라미터를 추가적으로 최적화하고 스톱 손실을 제어해야 한다.
/*backtest
start: 2022-10-23 00:00:00
end: 2023-10-29 00:00:00
period: 1d
basePeriod: 1h
exchanges: [{"eid":"Futures_Binance","currency":"BTC_USDT"}]
*/
// @version=4
// Credits
// "Vwap with period" code which used in this strategy to calculate the leadLine was written by "neolao" active on https://tr.tradingview.com/u/neolao/
// "TSV" code which used in this strategy was written by "liw0" active on https://www.tradingview.com/u/liw0. The code is corrected by "vitelot" December 2018.
// "Vidya" code which used in this strategy was written by "everget" active on https://tr.tradingview.com/u/everget/
strategy("HYE Combo Market [Strategy] (Vwap Mean Reversion + Trend Hunter)", overlay = true, initial_capital = 1000, default_qty_value = 100, default_qty_type = strategy.percent_of_equity, commission_value = 0.025)
//Strategy inputs
source = input(title = "Source", defval = close, group = "Mean Reversion Strategy Inputs")
smallcumulativePeriod = input(title = "Small VWAP", defval = 8, group = "Mean Reversion Strategy Inputs")
bigcumulativePeriod = input(title = "Big VWAP", defval = 10, group = "Mean Reversion Strategy Inputs")
meancumulativePeriod = input(title = "Mean VWAP", defval = 50, group = "Mean Reversion Strategy Inputs")
percentBelowToBuy = input(title = "Percent below to buy %", defval = 2, group = "Mean Reversion Strategy Inputs")
rsiPeriod = input(title = "Rsi Period", defval = 2, group = "Mean Reversion Strategy Inputs")
rsiEmaPeriod = input(title = "Rsi Ema Period", defval = 5, group = "Mean Reversion Strategy Inputs")
rsiLevelforBuy = input(title = "Maximum Rsi Level for Buy", defval = 30, group = "Mean Reversion Strategy Inputs")
slowtenkansenPeriod = input(9, minval=1, title="Slow Tenkan Sen VWAP Line Length", group = "Trend Hunter Strategy Inputs")
slowkijunsenPeriod = input(13, minval=1, title="Slow Kijun Sen VWAP Line Length", group = "Trend Hunter Strategy Inputs")
fasttenkansenPeriod = input(3, minval=1, title="Fast Tenkan Sen VWAP Line Length", group = "Trend Hunter Strategy Inputs")
fastkijunsenPeriod = input(7, minval=1, title="Fast Kijun Sen VWAP Line Length", group = "Trend Hunter Strategy Inputs")
BBlength = input(20, minval=1, title= "Bollinger Band Length", group = "Trend Hunter Strategy Inputs")
BBmult = input(2.0, minval=0.001, maxval=50, title="Bollinger Band StdDev", group = "Trend Hunter Strategy Inputs")
tsvlength = input(20, minval=1, title="TSV Length", group = "Trend Hunter Strategy Inputs")
tsvemaperiod = input(7, minval=1, title="TSV Ema Length", group = "Trend Hunter Strategy Inputs")
length = input(title="Vidya Length", type=input.integer, defval=20, group = "Trend Hunter Strategy Inputs")
src = input(title="Vidya Source", type=input.source, defval= hl2 , group = "Trend Hunter Strategy Inputs")
// Vidya Calculation
getCMO(src, length) =>
mom = change(src)
upSum = sum(max(mom, 0), length)
downSum = sum(-min(mom, 0), length)
out = (upSum - downSum) / (upSum + downSum)
out
cmo = abs(getCMO(src, length))
alpha = 2 / (length + 1)
vidya = 0.0
vidya := src * alpha * cmo + nz(vidya[1]) * (1 - alpha * cmo)
// Make input options that configure backtest date range
startDate = input(title="Start Date", type=input.integer,
defval=1, minval=1, maxval=31, group = "Strategy Date Range")
startMonth = input(title="Start Month", type=input.integer,
defval=1, minval=1, maxval=12, group = "Strategy Date Range")
startYear = input(title="Start Year", type=input.integer,
defval=2000, minval=1800, maxval=2100, group = "Strategy Date Range")
endDate = input(title="End Date", type=input.integer,
defval=31, minval=1, maxval=31, group = "Strategy Date Range")
endMonth = input(title="End Month", type=input.integer,
defval=12, minval=1, maxval=12, group = "Strategy Date Range")
endYear = input(title="End Year", type=input.integer,
defval=2021, minval=1800, maxval=2100, group = "Strategy Date Range")
inDateRange = true
// Mean Reversion Strategy Calculation
typicalPriceS = (high + low + close) / 3
typicalPriceVolumeS = typicalPriceS * volume
cumulativeTypicalPriceVolumeS = sum(typicalPriceVolumeS, smallcumulativePeriod)
cumulativeVolumeS = sum(volume, smallcumulativePeriod)
smallvwapValue = cumulativeTypicalPriceVolumeS / cumulativeVolumeS
typicalPriceB = (high + low + close) / 3
typicalPriceVolumeB = typicalPriceB * volume
cumulativeTypicalPriceVolumeB = sum(typicalPriceVolumeB, bigcumulativePeriod)
cumulativeVolumeB = sum(volume, bigcumulativePeriod)
bigvwapValue = cumulativeTypicalPriceVolumeB / cumulativeVolumeB
typicalPriceM = (high + low + close) / 3
typicalPriceVolumeM = typicalPriceM * volume
cumulativeTypicalPriceVolumeM = sum(typicalPriceVolumeM, meancumulativePeriod)
cumulativeVolumeM = sum(volume, meancumulativePeriod)
meanvwapValue = cumulativeTypicalPriceVolumeM / cumulativeVolumeM
rsiValue = rsi(source, rsiPeriod)
rsiEMA = ema(rsiValue, rsiEmaPeriod)
buyMA = ((100 - percentBelowToBuy) / 100) * bigvwapValue[0]
inTrade = strategy.position_size > 0
notInTrade = strategy.position_size <= 0
if(crossunder(smallvwapValue, buyMA) and rsiEMA < rsiLevelforBuy and close < meanvwapValue and inDateRange and notInTrade)
strategy.entry("BUY-M", strategy.long)
if(close > meanvwapValue or not inDateRange)
strategy.close("BUY-M")
// Trend Hunter Strategy Calculation
// Slow Tenkan Sen Calculation
typicalPriceTS = (high + low + close) / 3
typicalPriceVolumeTS = typicalPriceTS * volume
cumulativeTypicalPriceVolumeTS = sum(typicalPriceVolumeTS, slowtenkansenPeriod)
cumulativeVolumeTS = sum(volume, slowtenkansenPeriod)
slowtenkansenvwapValue = cumulativeTypicalPriceVolumeTS / cumulativeVolumeTS
// Slow Kijun Sen Calculation
typicalPriceKS = (high + low + close) / 3
typicalPriceVolumeKS = typicalPriceKS * volume
cumulativeTypicalPriceVolumeKS = sum(typicalPriceVolumeKS, slowkijunsenPeriod)
cumulativeVolumeKS = sum(volume, slowkijunsenPeriod)
slowkijunsenvwapValue = cumulativeTypicalPriceVolumeKS / cumulativeVolumeKS
// Fast Tenkan Sen Calculation
typicalPriceTF = (high + low + close) / 3
typicalPriceVolumeTF = typicalPriceTF * volume
cumulativeTypicalPriceVolumeTF = sum(typicalPriceVolumeTF, fasttenkansenPeriod)
cumulativeVolumeTF = sum(volume, fasttenkansenPeriod)
fasttenkansenvwapValue = cumulativeTypicalPriceVolumeTF / cumulativeVolumeTF
// Fast Kijun Sen Calculation
typicalPriceKF = (high + low + close) / 3
typicalPriceVolumeKF = typicalPriceKS * volume
cumulativeTypicalPriceVolumeKF = sum(typicalPriceVolumeKF, fastkijunsenPeriod)
cumulativeVolumeKF = sum(volume, fastkijunsenPeriod)
fastkijunsenvwapValue = cumulativeTypicalPriceVolumeKF / cumulativeVolumeKF
// Slow LeadLine Calculation
lowesttenkansen_s = lowest(slowtenkansenvwapValue, slowtenkansenPeriod)
highesttenkansen_s = highest(slowtenkansenvwapValue, slowtenkansenPeriod)
lowestkijunsen_s = lowest(slowkijunsenvwapValue, slowkijunsenPeriod)
highestkijunsen_s = highest(slowkijunsenvwapValue, slowkijunsenPeriod)
slowtenkansen = avg(lowesttenkansen_s, highesttenkansen_s)
slowkijunsen = avg(lowestkijunsen_s, highestkijunsen_s)
slowleadLine = avg(slowtenkansen, slowkijunsen)
// Fast LeadLine Calculation
lowesttenkansen_f = lowest(fasttenkansenvwapValue, fasttenkansenPeriod)
highesttenkansen_f = highest(fasttenkansenvwapValue, fasttenkansenPeriod)
lowestkijunsen_f = lowest(fastkijunsenvwapValue, fastkijunsenPeriod)
highestkijunsen_f = highest(fastkijunsenvwapValue, fastkijunsenPeriod)
fasttenkansen = avg(lowesttenkansen_f, highesttenkansen_f)
fastkijunsen = avg(lowestkijunsen_f, highestkijunsen_f)
fastleadLine = avg(fasttenkansen, fastkijunsen)
// BBleadLine Calculation
BBleadLine = avg(fastleadLine, slowleadLine)
// Bollinger Band Calculation
basis = sma(BBleadLine, BBlength)
dev = BBmult * stdev(BBleadLine, BBlength)
upper = basis + dev
lower = basis - dev
// TSV Calculation
tsv = sum(close>close[1]?volume*(close-close[1]):close<close[1]?volume*(close-close[1]):0,tsvlength)
tsvema = ema(tsv, tsvemaperiod)
// Rules for Entry & Exit
if(fastleadLine > fastleadLine[1] and slowleadLine > slowleadLine[1] and tsv > 0 and tsv > tsvema and close > upper and close > vidya and inDateRange and notInTrade)
strategy.entry("BUY-T", strategy.long)
if((fastleadLine < fastleadLine[1] and slowleadLine < slowleadLine[1]) or not inDateRange)
strategy.close("BUY-T")
// Plots
plot(meanvwapValue, title="MEAN VWAP", linewidth=2, color=color.yellow)
//plot(vidya, title="VIDYA", linewidth=2, color=color.green)
//colorsettingS = input(title="Solid Color Slow Leadline", defval=false, type=input.bool)
//plot(slowleadLine, title = "Slow LeadLine", color = colorsettingS ? color.aqua : slowleadLine > slowleadLine[1] ? color.green : color.red, linewidth=3)
//colorsettingF = input(title="Solid Color Fast Leadline", defval=false, type=input.bool)
//plot(fastleadLine, title = "Fast LeadLine", color = colorsettingF ? color.orange : fastleadLine > fastleadLine[1] ? color.green : color.red, linewidth=3)
//p1 = plot(upper, "Upper BB", color=#2962FF)
//p2 = plot(lower, "Lower BB", color=#2962FF)
//fill(p1, p2, title = "Background", color=color.blue)
//plot(smallvwapValue, color=#13C425, linewidth=2)
//plot(bigvwapValue, color=#CA1435, linewidth=2)