볼린저 밴드 기반 단기 추세 추적 전략


생성 날짜: 2023-11-23 17:01:12 마지막으로 수정됨: 2023-11-23 17:01:12
복사: 0 클릭수: 706
avatar of ChaoZhang ChaoZhang
1
집중하다
1617
수행원

볼린저 밴드 기반 단기 추세 추적 전략

개요

부린 띠 돌파 전략은 부린 띠 지표에 기반한 단기 트렌드 추적형 전략이다. 이 전략은 다목적 및 공백 두 방향의 작업을 수행할 수 있으며, 현금과 상시 계약에 적용되며, 특히 트렌드 상황에는 적합하다.

이 전략은 매우 구성성이 높으며, 사용자가 브린밴드의 매개 변수 기간과 오차, 트렌드 필터, 변동성 필터, 거래 방향 필터, 변동률 필터 및 날짜 필터 등을 설정할 수 있습니다. 또한, 다중 헤드 포지션과 빈 헤드 포지션에 대한 중지, 중지 및 추적 중지 손실을 설정하여 전체적인 위험 관리 방법을 보장합니다. 매일 최대 손실이 추가되어 다른 보호 계층을 제공하여 신뢰할 수있는 전문화된 적응형 거래 시스템입니다.

전략 원칙

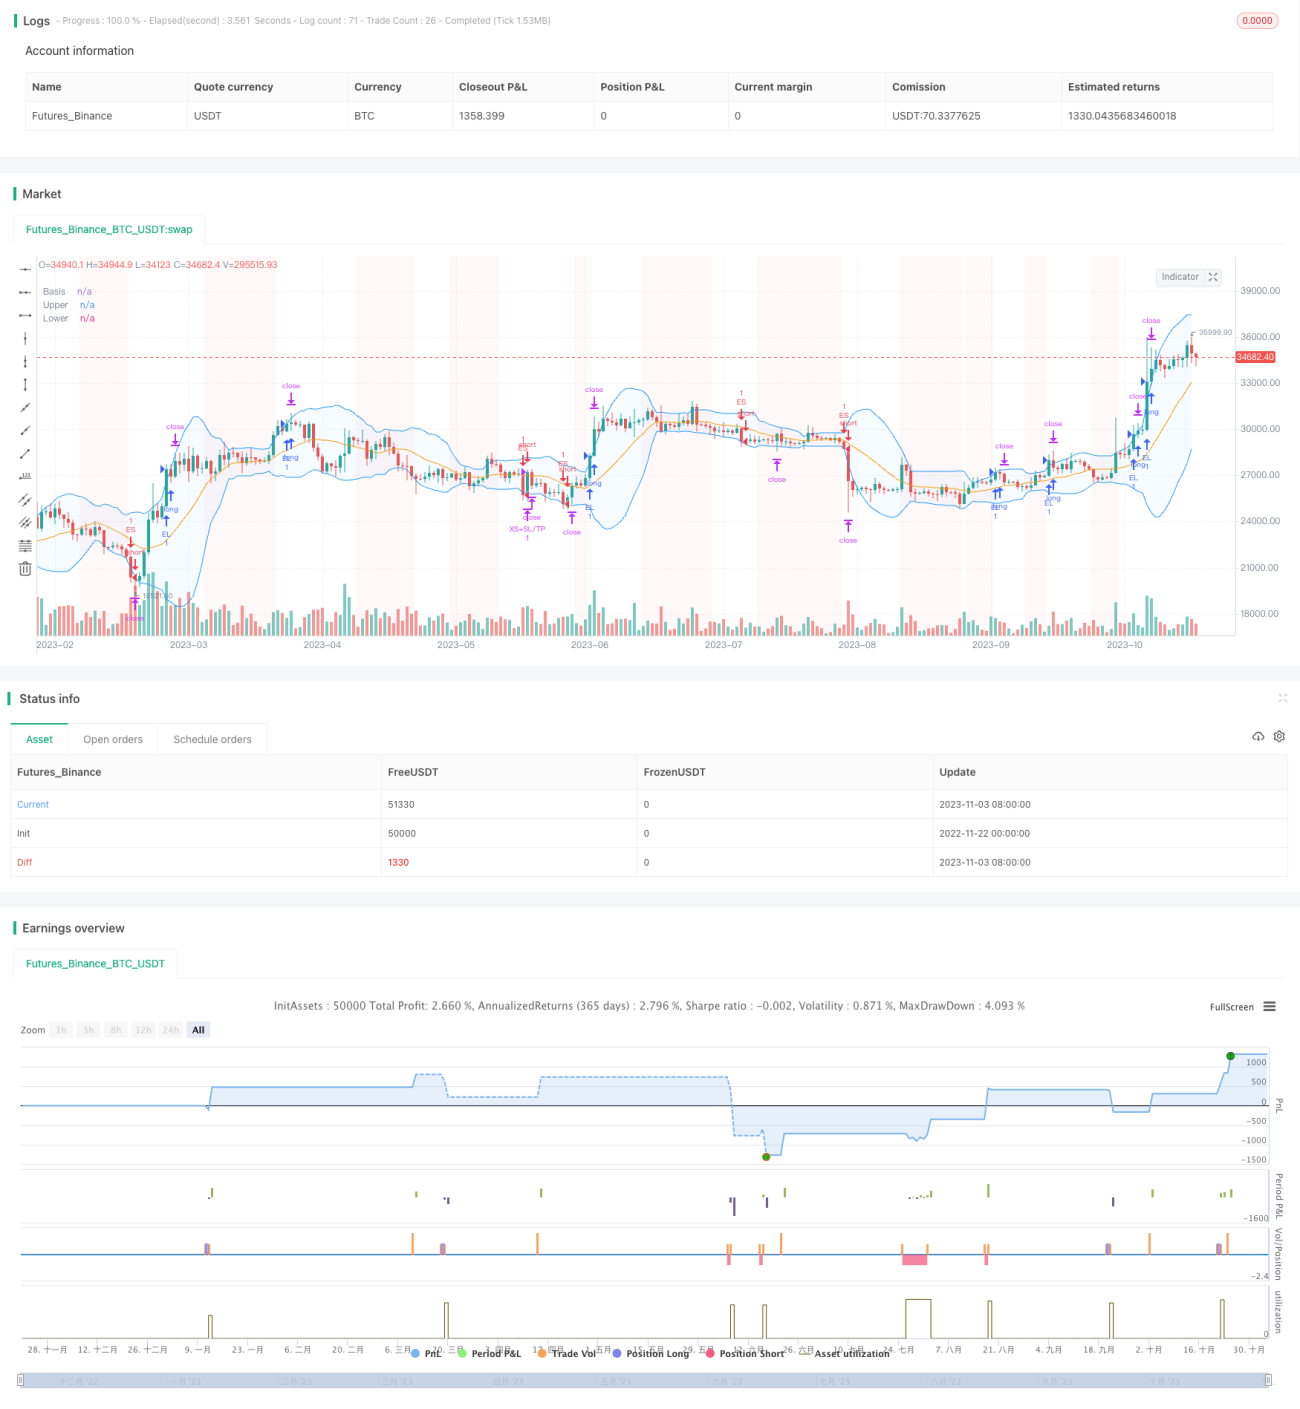
이 전략의 핵심 지표는 부린 띠이다. 부린 띠는 가격의 평균선, 변동의 상한 및 변동의 하한을 나타내는 중간선, 상한 및 하한의 세 개의 선으로 구성되어 있다. 가격이 상한을 돌파 할 때, 더 많은 것을하고, 가격이 하한을 돌파 할 때, 더 많은 것을 한다.

또한, 정책은 Noise 거래를 피하기 위해 여러 보조 필터를 설정했습니다. 이 필터에는 다음과 같은 것들이 포함됩니다.

  1. 트렌드 필터: 가격이 이동 평균 위에 더 많이 하고, 가격이 이동 평균 아래에 더 많이 한다.

  2. 변동성 필터: 변동성이 커질 때만 거래한다.

  3. 거래 방향 필터: 지표의 속성에 따라 더 많은 거래, 더 적은 거래 또는 양방향 거래만 선택하십시오.

  4. 변화율 필터: 가격이 이전 거래일 종점 가격에 대한 변화율이 일정 수준에 도달했을 때만 들어갑니다.

  5. 날짜 필터: 재측정된 시간 간격을 설정한다.

모든 필터 조건이 충족되면 거래 신호가 발생한다. 정지, 중단 및 추적 중지 손실은 위험 관리를 보장한다. 또한 최대 일일 손실 설정은 일일 대규모 회수를 방지한다.

우위 분석

이 전략은 다음과 같은 장점을 가지고 있습니다.

  1. 브린 띠를 핵심 거래 신호로 사용하고 있으며 신뢰성이 높습니다.

  2. 다중 필터 디자인은 잘못된 거래를 방지하고, 구성성이 강합니다.

  3. 스톱, 스톱, 스톱 트래킹은 포괄적이고 유연합니다.

  4. 최대 일일 손실 설정 효과 제어 일일 철회

  5. 트렌드 시장에 적합하고 수익 가능성이 높습니다.

위험 분석

이 전략에는 위험도 있습니다.

  1. 브린 벨트 돌파는 상부 가짜 돌파구와 하부 가짜 돌파구로 쉽게 형성되며, 이로 인해 손해가 발생할 수 있습니다.

  2. 시장에서 너무 엄격한 필터링으로 거래 기회를 놓칠 수 있습니다.

  3. 큰 폭의 폭파로 인한 손실은 직접적으로 제지선을 뚫고 발생할 수 있습니다.

  4. 극한의 경우, 엄청난 손실을 완전히 피할 수는 없습니다.

위와 같은 위험으로, 필터링 조건을 적절히 완화하거나, 수동적으로 개입하여 일부 포지션을 닫거나, 스톱 손실 거리를 줄일 수 있다.

최적화 방향

이 전략은 다음과 같은 부분에서 최적화를 고려할 수 있습니다.

  1. 다른 변수 조합을 시도하여 최적의 변수 범위를 찾습니다.

  2. 기계학습 모델을 추가하여 역학적 최적화를 구현합니다.

  3. 더 효율적인 시간, 진동, 진동장애를 연구하는 것.

  4. 감정적 인 지표와 함께 극단적 인 행동에 적극적으로 개입하십시오.

  5. 관련 상품과 결합하여 통계적 중개로 진행한다.

요약하다

부린 띠 돌파 전략 (Brin Belt Breakthrough Strategy) 은 성숙한 신뢰할 수 있는 단선 트렌드 추적 전략이다. 부린 띠 지표를 신호로 사용하며, 신호의 신뢰성을 보장하는 여러 필터를 설정한다. 동시에, 포괄적 인 중단 및 위험 관리 메커니즘이 위험을 통제한다. 이 전략은 활발한 트렌드 시장에 적합하며, 좋은 수익 잠재력을 가지고 있다. 지속적으로 최적화하면 강력한 정량화 거래 시스템이 될 가능성이 있다.

전략 소스 코드
/*backtest
start: 2022-11-22 00:00:00
end: 2023-11-04 05:20:00
period: 1d
basePeriod: 1h
exchanges: [{"eid":"Futures_Binance","currency":"BTC_USDT"}]
*/


//@version=5
strategy("Bollinger Bands - Breakout Strategy",overlay=true
         )


// Define the length of the Bollinger Bands
bbLengthInput = input.int (15,title="Length", group="Bollinger Bands", inline="BB")
bbDevInput = input.float (2.0,title="StdDev", group="Bollinger Bands", inline="BB")

// Define the settings for the Trend Filter
trendFilterInput = input.bool(false, title="Above/Below", group = "Trend Filter", inline="Trend")
trendFilterPeriodInput = input(223,title="", group = "Trend Filter", inline="Trend")
trendFilterType = input.string (title="", defval="EMA",options=["EMA","SMA","RMA", "WMA"], group = "Trend Filter", inline="Trend")

volatilityFilterInput = input.bool(true,title="StdDev", group = "Volatility Filter", inline="Vol")
volatilityFilterStDevLength = input(15,title="",group = "Volatility Filter", inline="Vol")
volatilityStDevMaLength = input(15,title=">MA",group = "Volatility Filter", inline="Vol")

// ROC Filter

// f_security function by LucF for PineCoders available here: https://www.tradingview.com/script/cyPWY96u-How-to-avoid-repainting-when-using-security-PineCoders-FAQ/
f_security(_sym, _res, _src, _rep) => request.security(_sym, _res, _src[not _rep and barstate.isrealtime ? 1 : 0])[_rep or barstate.isrealtime ? 0 : 1]
high_daily = f_security(syminfo.tickerid, "D", high, false)

roc_enable = input.bool(false, "", group="ROC Filter from CloseD", inline="roc")
roc_threshold = input.float(1, "Treshold", step=0.5, group="ROC Filter from CloseD", inline="roc")

closed = f_security(syminfo.tickerid,"1D",close, false)
roc_filter= roc_enable ? (close-closed)/closed*100  > roc_threshold : true

// Trade Direction Filter

// tradeDirectionInput = input.string("Auto",options=["Auto", "Long&Short","Long Only", "Short Only"], title="Trade", group="Direction Filter", tooltip="Auto: if a PERP is detected (in the symbol description), trade long and short\n Otherwise as per user-input")

// tradeDirection = switch tradeDirectionInput
// 	"Auto" => str.contains(str.lower(syminfo.description), "perp") or str.contains(str.lower(syminfo.description), ".p") ? strategy.direction.all : strategy.direction.long
// 	"Long&Short" => strategy.direction.all
// 	"Long Only" => strategy.direction.long
//     "Short Only" => strategy.direction.short
// 	=> strategy.direction.all

// strategy.risk.allow_entry_in(tradeDirection)


// Calculate and plot the Bollinger Bands
[bbMiddle, bbUpper, bbLower] = ta.bb (close, bbLengthInput, bbDevInput)

plot(bbMiddle, "Basis", color=color.orange)
bbUpperPlot = plot(bbUpper, "Upper", color=color.blue)
bbLowerrPlot = plot(bbLower, "Lower", color=color.blue)
fill(bbUpperPlot, bbLowerrPlot, title = "Background", color=color.new(color.blue, 95))


// Calculate and view Trend Filter

float tradeConditionMa = switch trendFilterType
	"EMA" => ta.ema(close, trendFilterPeriodInput)
	"SMA" => ta.sma(close, trendFilterPeriodInput)
	"RMA" => ta.rma(close, trendFilterPeriodInput)
    "WMA" => ta.wma(close, trendFilterPeriodInput)
	// Default used when the three first cases do not match.
	=> ta.wma(close, trendFilterPeriodInput)


trendConditionLong  = trendFilterInput ? close > tradeConditionMa : true
trendConditionShort = trendFilterInput ? close < tradeConditionMa : true
plot(trendFilterInput ? tradeConditionMa : na, color=color.yellow)

// Calculate and view Volatility Filter

stdDevClose = ta.stdev(close,volatilityFilterStDevLength)
volatilityCondition = volatilityFilterInput ? stdDevClose > ta.sma(stdDevClose,volatilityStDevMaLength) : true

bbLowerCrossUnder =  ta.crossunder(close, bbLower)
bbUpperCrossOver =  ta.crossover(close, bbUpper)

bgcolor(volatilityCondition ? na : color.new(color.red, 95))


// Date Filter

start = input(timestamp("2017-01-01"), "Start", group="Date Filter")
finish = input(timestamp("2050-01-01"), "End", group="Date Filter")

date_filter = true

// Entry and Exit Conditions

entryLongCondition = bbUpperCrossOver and trendConditionLong and volatilityCondition and date_filter and roc_filter
entryShortCondition = bbLowerCrossUnder and trendConditionShort and volatilityCondition and date_filter and roc_filter

exitLongCondition = bbLowerCrossUnder
exitShortCondition = bbUpperCrossOver

// Orders

if entryLongCondition
    strategy.entry("EL", strategy.long)

if entryShortCondition
    strategy.entry("ES", strategy.short)

if exitLongCondition
    strategy.close("EL")

if exitShortCondition
    strategy.close("ES")


// Long SL/TP/TS

xl_ts_percent      = input.float(2,step=0.5, title= "TS", group="Exit Long", inline="LTS", tooltip="Trailing Treshold %")
xl_to_percent      = input.float(0.5, step=0.5, title= "TO", group="Exit Long", inline="LTS", tooltip="Trailing Offset %")

xl_ts_tick = xl_ts_percent * close/syminfo.mintick/100
xl_to_tick = xl_to_percent * close/syminfo.mintick/100

xl_sl_percent      = input.float (2, step=0.5, title="SL",group="Exit Long", inline="LSLTP") 
xl_tp_percent      = input.float(9, step=0.5, title="TP",group="Exit Long", inline="LSLTP")

xl_sl_price = strategy.position_avg_price * (1-xl_sl_percent/100)
xl_tp_price = strategy.position_avg_price * (1+xl_tp_percent/100)

strategy.exit("XL+SL/TP", "EL", stop=xl_sl_price, limit=xl_tp_price, trail_points=xl_ts_tick, trail_offset=xl_to_tick,comment_loss= "XL-SL", comment_profit = "XL-TP",comment_trailing = "XL-TS")

// Short SL/TP/TS
xs_ts_percent      = input.float(2,step=0.5, title= "TS",group="Exit Short", inline ="STS", tooltip="Trailing Treshold %")
xs_to_percent      = input.float(0.5, step=0.5, title= "TO",group="Exit Short", inline ="STS", tooltip="Trailing Offset %")

xs_ts_tick = xs_ts_percent * close/syminfo.mintick/100
xs_to_tick = xs_to_percent * close/syminfo.mintick/100

xs_sl_percent      = input.float (2, step=0.5, title="SL",group="Exit Short", inline="ESSLTP", tooltip="Stop Loss %") 
xs_tp_percent      = input.float(9, step=0.5, title="TP",group="Exit Short",  inline="ESSLTP", tooltip="Take Profit %")

xs_sl_price = strategy.position_avg_price * (1+xs_sl_percent/100)
xs_tp_price = strategy.position_avg_price * (1-xs_tp_percent/100)

strategy.exit("XS+SL/TP", "ES", stop=xs_sl_price, limit=xs_tp_price, trail_points=xs_ts_tick, trail_offset=xs_to_tick,comment_loss= "XS-SL", comment_profit = "XS-TP",comment_trailing = "XS-TS")


max_intraday_loss = input.int(10, title="Max Intraday Loss (Percent)", group="Risk Management")

//strategy.risk.max_intraday_loss(max_intraday_loss, strategy.percent_of_equity)

// Monthly Returns table, modified from QuantNomad. Please put calc_on_every_tick = true to plot it. 

monthly_table(int results_prec, bool results_dark) =>
    new_month = month(time) != month(time[1])
    new_year  = year(time)  != year(time[1])
    
    eq = strategy.equity
    
    bar_pnl = eq / eq[1] - 1
    
    cur_month_pnl = 0.0
    cur_year_pnl  = 0.0
    
    // Current Monthly P&L
    cur_month_pnl := new_month ? 0.0 : 
                     (1 + cur_month_pnl[1]) * (1 + bar_pnl) - 1 
    
    // Current Yearly P&L
    cur_year_pnl := new_year ? 0.0 : 
                     (1 + cur_year_pnl[1]) * (1 + bar_pnl) - 1  
    
    // Arrays to store Yearly and Monthly P&Ls
    var month_pnl  = array.new_float(0)
    var month_time = array.new_int(0)
    
    var year_pnl  = array.new_float(0)
    var year_time = array.new_int(0)
    
    last_computed = false
    
    if (not na(cur_month_pnl[1]) and (new_month or barstate.islast))
        if (last_computed[1])
            array.pop(month_pnl)
            array.pop(month_time)
            
        array.push(month_pnl , cur_month_pnl[1])
        array.push(month_time, time[1])
    
    if (not na(cur_year_pnl[1]) and (new_year or barstate.islast))
        if (last_computed[1])
            array.pop(year_pnl)
            array.pop(year_time)
            
        array.push(year_pnl , cur_year_pnl[1])
        array.push(year_time, time[1])
    
    last_computed := barstate.islast ? true : nz(last_computed[1])
    
    // Monthly P&L Table    
    var monthly_table = table(na)
    
    cell_hr_bg_color = results_dark ? #0F0F0F : #F5F5F5
    cell_hr_text_color = results_dark ? #D3D3D3 : #555555
    cell_border_color = results_dark ? #000000 : #FFFFFF

    // ell_hr_bg_color = results_dark ? #0F0F0F : #F5F5F5
    // cell_hr_text_color = results_dark ? #D3D3D3 : #555555
    // cell_border_color = results_dark ? #000000 : #FFFFFF
    if (barstate.islast)
        monthly_table := table.new(position.bottom_right, columns = 14, rows = array.size(year_pnl) + 1, bgcolor=cell_hr_bg_color,border_width=1,border_color=cell_border_color)
    
        table.cell(monthly_table, 0,  0, syminfo.tickerid + " " + timeframe.period,     text_color=cell_hr_text_color, bgcolor=cell_hr_bg_color)
        table.cell(monthly_table, 1,  0, "Jan",  text_color=cell_hr_text_color, bgcolor=cell_hr_bg_color)
        table.cell(monthly_table, 2,  0, "Feb",  text_color=cell_hr_text_color, bgcolor=cell_hr_bg_color)
        table.cell(monthly_table, 3,  0, "Mar",  text_color=cell_hr_text_color, bgcolor=cell_hr_bg_color)
        table.cell(monthly_table, 4,  0, "Apr",  text_color=cell_hr_text_color, bgcolor=cell_hr_bg_color)
        table.cell(monthly_table, 5,  0, "May",  text_color=cell_hr_text_color, bgcolor=cell_hr_bg_color)
        table.cell(monthly_table, 6,  0, "Jun",  text_color=cell_hr_text_color, bgcolor=cell_hr_bg_color)
        table.cell(monthly_table, 7,  0, "Jul",  text_color=cell_hr_text_color, bgcolor=cell_hr_bg_color)
        table.cell(monthly_table, 8,  0, "Aug",  text_color=cell_hr_text_color, bgcolor=cell_hr_bg_color)
        table.cell(monthly_table, 9,  0, "Sep",  text_color=cell_hr_text_color, bgcolor=cell_hr_bg_color)
        table.cell(monthly_table, 10, 0, "Oct",  text_color=cell_hr_text_color, bgcolor=cell_hr_bg_color)
        table.cell(monthly_table, 11, 0, "Nov",  text_color=cell_hr_text_color, bgcolor=cell_hr_bg_color)
        table.cell(monthly_table, 12, 0, "Dec",  text_color=cell_hr_text_color, bgcolor=cell_hr_bg_color)
        table.cell(monthly_table, 13, 0, "Year", text_color=cell_hr_text_color, bgcolor=cell_hr_bg_color)
    
        for yi = 0 to array.size(year_pnl) - 1
            table.cell(monthly_table, 0,  yi + 1, str.tostring(year(array.get(year_time, yi))), text_color=cell_hr_text_color, bgcolor=cell_hr_bg_color)
            
            y_color = array.get(year_pnl, yi) > 0 ? color.lime :  array.get(year_pnl, yi) < 0 ? color.red : color.gray
            table.cell(monthly_table, 13, yi + 1, str.tostring(math.round(array.get(year_pnl, yi) * 100, results_prec)), bgcolor = y_color)
            
        for mi = 0 to array.size(month_time) - 1
            m_row   = year(array.get(month_time, mi))  - year(array.get(year_time, 0)) + 1
            m_col   = month(array.get(month_time, mi)) 
            m_color = array.get(month_pnl, mi) > 0 ? color.lime : array.get(month_pnl, mi) < 0 ? color.red : color.gray
            
            table.cell(monthly_table, m_col, m_row, str.tostring(math.round(array.get(month_pnl, mi) * 100, results_prec)), bgcolor = m_color)

results_prec = input(2, title = "Precision", group="Results Table")
results_dark = input.bool(defval=true, title="Dark Mode", group="Results Table")
monthly_table(results_prec, results_dark)