개요
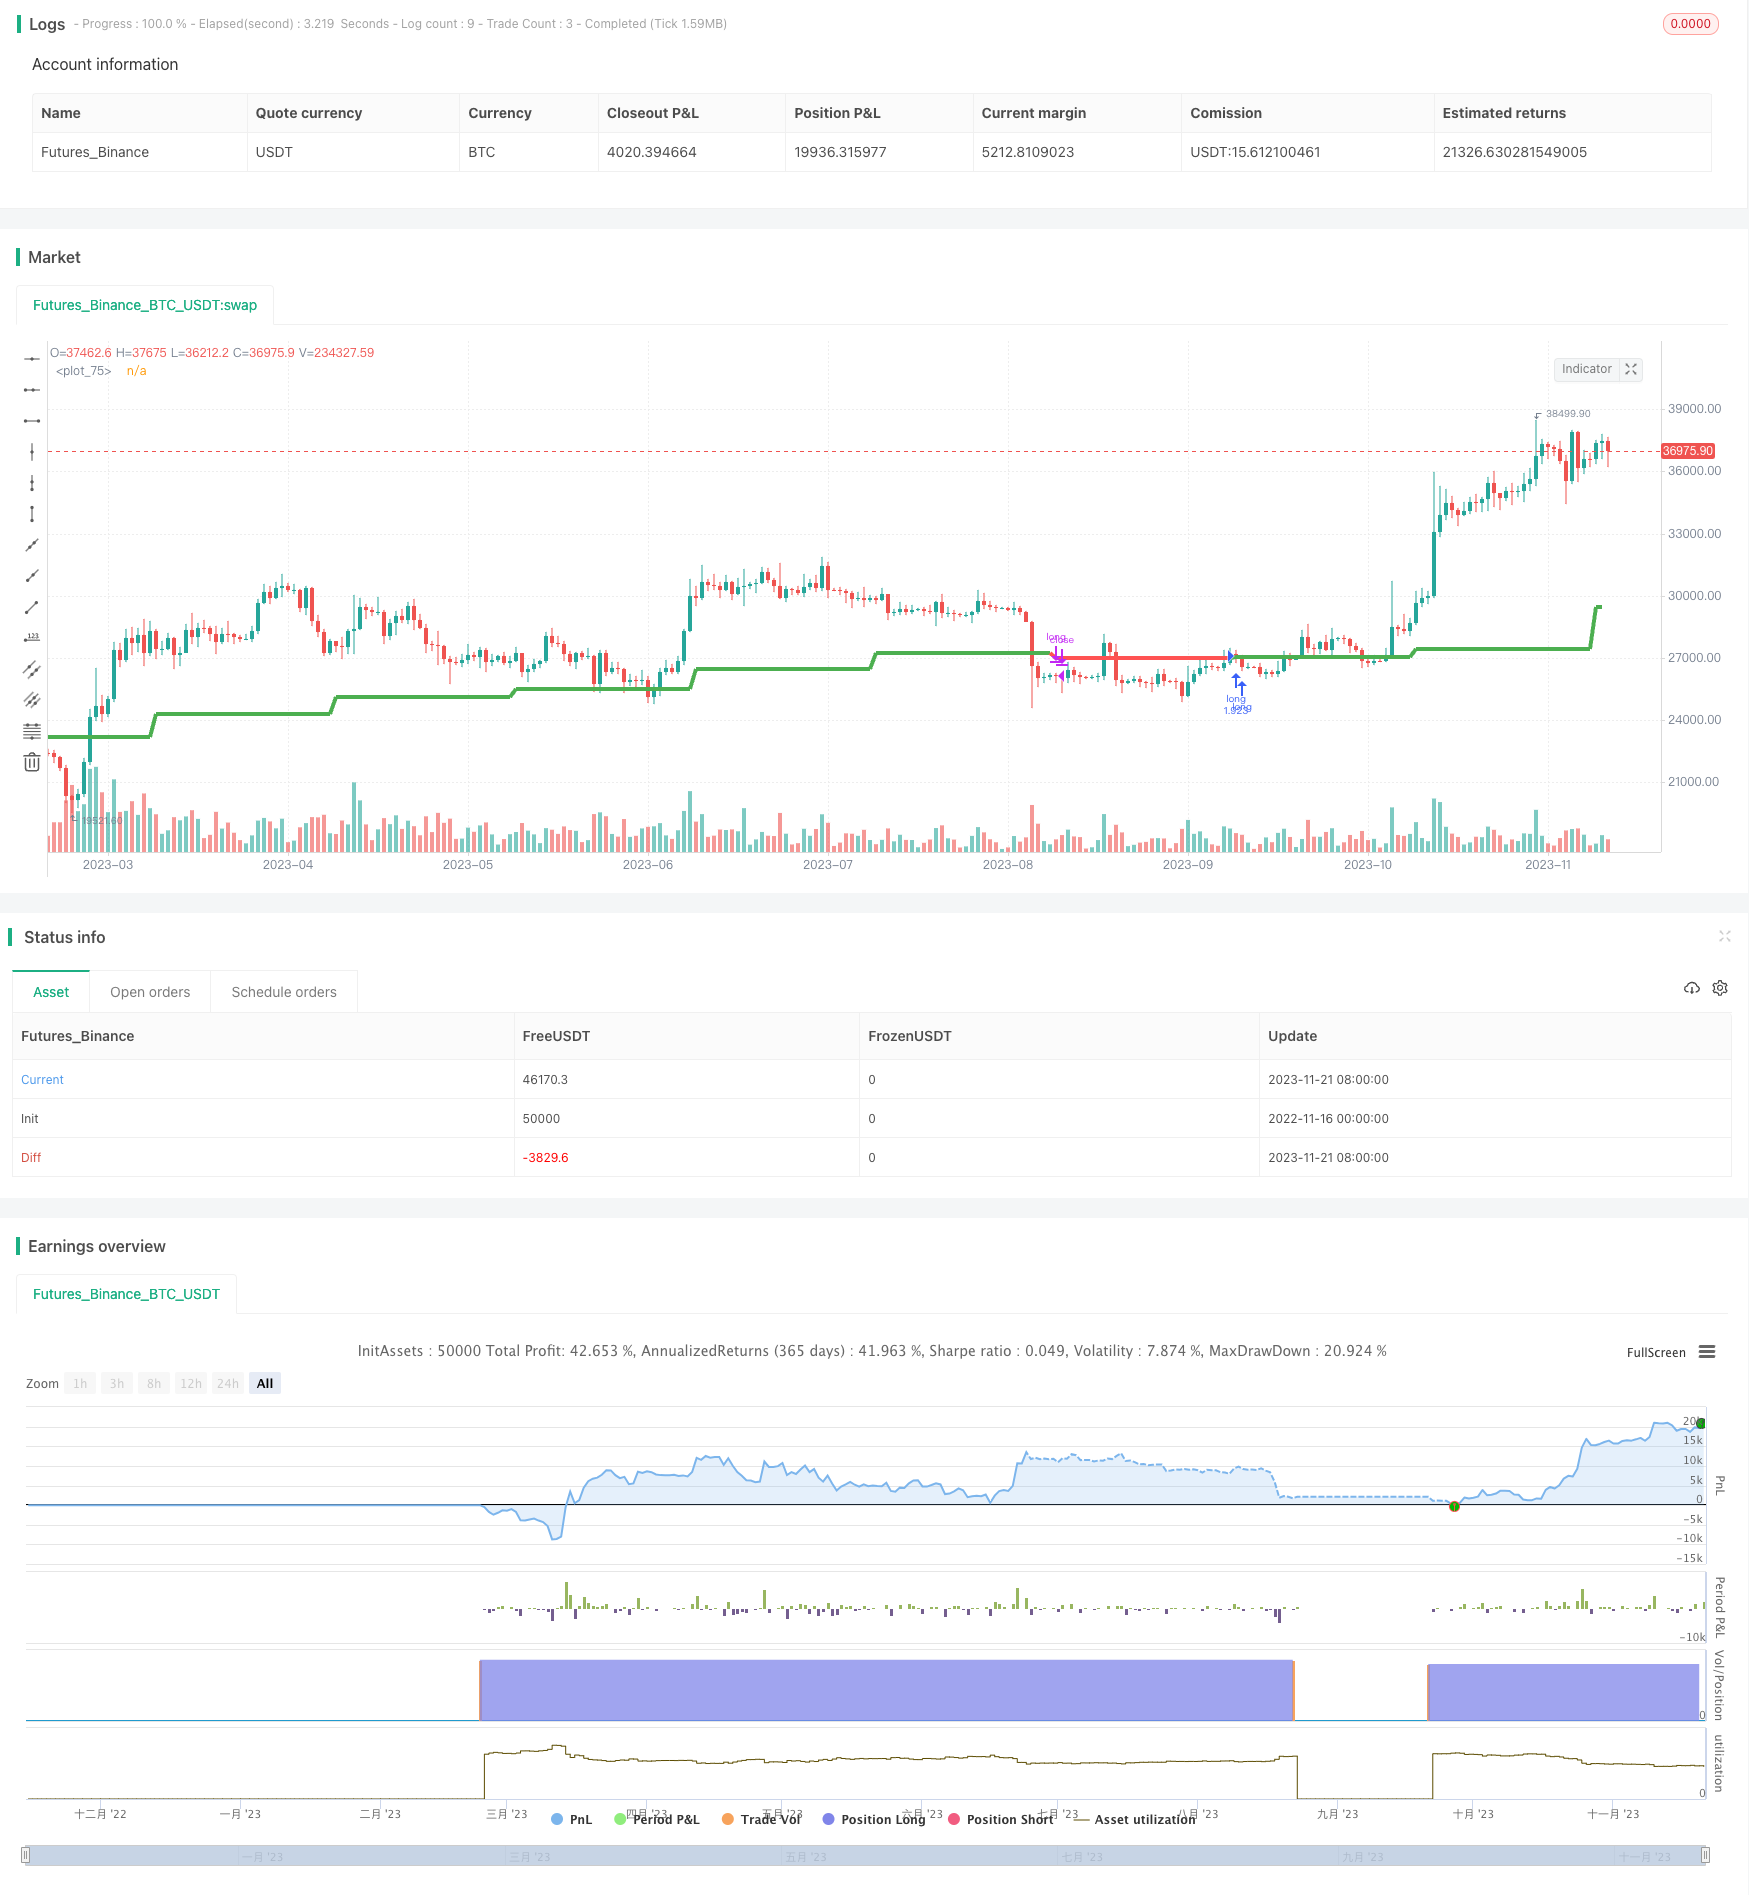
이 전략은 월선 종결 가격과 이동 평균의 교차를 이용하여 거래 신호를 생성한다. 월선 종결 가격 위에 이동 평균을 통과할 때, 더 많이 하고, 월선 종결 가격 아래에서 이동 평균을 통과할 때, 평소한다.
전략 원칙
이 전략의 핵심 논리는 다음과 같습니다.
- 이동 평균의 주기 변수를 입력하고 SMA 또는 EMA를 선택할 수 있습니다.
- 이동 평균선을 표시할 수 있습니다.
- 다른 주식의 종식 가격을 선택하여 신호로 사용할 수 있습니다.
- 월선 종식 가격과 이동 평균의 관계에 따라 거래 신호를 판단하는
- 마감 가격에 이동 평균선을 써서 더 많이 해라
- 마감 가격 아래로 이동 평균선, 평지
이 전략은 이동 평균선의 평평한 특성을 활용하여 가격의 일부 소음을 필터링하여 주가 가격의 중기 경향의 전환을 포착한다. 주가 가격이 평균선을 넘으면 주가 가격이 황소 시장 추세를 형성하고 있음을 나타냅니다. 주가 가격이 평균선을 넘으면 주가 가격 추세가 곰 시장으로 바뀌고 있음을 나타냅니다.
전략적 이점
이 전략의 주요 장점은 다음과 같습니다.
- 월선 데이터를 활용하여 밤새의 소음을 효과적으로 필터링하여 중·장기 주가 트렌드를 포착합니다.
- 사용자 정의 이동 평균 순환, 다른 주식에 맞게 최적화 변수
- 다른 주식을 신호원으로 선택하여 안정성을 높일 수 있습니다.
- 첨단 anti-repainting 기술을 사용하여 회귀를 효과적으로 방지합니다.
- 테스트 최적화를 위해 임의의 재측정 시간 주기를 입력할 수 있습니다.
전반적으로, 이 전략의 프레임워크는 간단하고 실용적이며, 파라미터 최적화를 통해 대부분의 주식에 적용할 수 있으며, 특히 중장기 투자자들에게 적합하다.
전략적 위험
이 전략에는 다음과 같은 몇 가지 측면에 초점을 맞춘 몇 가지 위험도 있습니다.
- 월간 데이터 업데이트가 느려서 실시간 가격 변화를 반영할 수 없습니다.
- 이 경우, 거래가 늦어지고, 단선 거래 기회를 놓칠 수 있습니다.
- 이동 평균선은 지연성이 있으며, 신호를 생성하는 시점은 통제할 수 없다.
- 잘못 선택된 파라미터는 너무 보수적이거나 기회를 놓칠 수 있습니다.
위험성을 줄이기 위해 다음과 같은 부분에서 최적화할 수 있습니다.
- 더 낮은 시간 프레임과 결합된 기술 지표에 대한 보조 판단
- 이동 평균 선 주기를 조정하여 최적의 변수 조합을 찾습니다.
- 더 안정적인 신호를 신호로 사용한다.
- 적당히 포지션 규모를 조정하여 단기 손실을 통제하십시오.
전략 최적화 방향
이 전략은 크게 최적화 할 수 있으며 다음과 같은 부분에서 최적화 할 수 있습니다.
- 수익을 고정하고 위험을 통제하기 위해 손실을 막는 전략을 추가하십시오.
- KD, MACD 등의 다른 지표와 결합하여 거래 신호의 정확성을 향상시킵니다.
- 기계 학습 기술을 사용하여 이동 평균선 변수를 동적으로 최적화합니다.
- 포지션 관리 모듈을 추가하여 포지션의 트렌드 알로카토사이즈를 변경합니다.
- 시장 상황에 따라 유연하게 조정할 수 있는 다공간 전환 기능이 추가되었습니다.
- 더 낮은 시간 프레임의 K선으로 연결하여 더 민감한 거래를 수행합니다.
요약하다
월선 종식 가격과 이동평균선 교차 전략의 전체적인 아이디어는 명확하고 구현하기 쉬운 것으로, 매개 변수를 조정하여 다른 주식에 적용할 수 있으며, 특히 중장선 투자자에게 적합하다.
전략 소스 코드
/*backtest
start: 2022-11-16 00:00:00
end: 2023-11-22 00:00:00
period: 1d
basePeriod: 1h
exchanges: [{"eid":"Futures_Binance","currency":"BTC_USDT"}]
*/

// This source code is subject to the terms of the Mozilla Public License 2.0 at https://mozilla.org/MPL/2.0/
// © universique

//@version=4
strategy("Monthly MA Close ", shorttitle="MMAC", overlay=true, default_qty_type =  strategy.percent_of_equity, default_qty_value = 100)
//MAY 6 2020 18:00

// No repaint function
// Function to securely and simply call `security()` so that it never repaints and never looks ahead.
f_secureSecurity(_symbol, _res, _src) => security(_symbol, _res, _src[1], lookahead = barmerge.lookahead_on)
//sec10 = f_secureSecurity(syminfo.tickerid, higherTf, data)

// ————— Converts current chart resolution into a float minutes value.
f_resInMinutes() =>
    _resInMinutes = timeframe.multiplier * (
      timeframe.isseconds ? 1. / 60             :
      timeframe.isminutes ? 1.                  :
      timeframe.isdaily   ? 60. * 24            :
      timeframe.isweekly  ? 60. * 24 * 7        :
      timeframe.ismonthly ? 60. * 24 * 30.4375  : na)
// ————— Returns the float minutes value of the string _res.
f_tfResInMinutes(_res) =>
    // _res: resolution of any TF (in "timeframe.period" string format).
    // Dependency: f_resInMinutes().
    security(syminfo.tickerid, _res, f_resInMinutes())

// —————————— Determine if current timeframe is smaller that higher timeframe selected in Inputs.
// Get higher timeframe in minutes.
//higherTfInMinutes = f_tfResInMinutes(higherTf)
// Get current timeframe in minutes.
currentTfInMinutes = f_resInMinutes()
// Compare current TF to higher TF to make sure it is smaller, otherwise our plots don't make sense.
//chartOnLowerTf = currentTfInMinutes < higherTfInMinutes

// Input
switch1=input(true, title="Show MA")
exponential = input(true, title="Exponential MA")
ticker = input(false, title="Other ticker MA")

tic_ma = input(title="Ticker MA", type=input.symbol, defval="BTC_USDT:swap")
res_ma = input(title="Time MA (W, D, [min])", type=input.string, defval="M")
len_ma = input(8, minval=1, title="Period MA")

ma_cus = exponential?f_secureSecurity(tic_ma, res_ma, ema(close,len_ma)) : f_secureSecurity(tic_ma, res_ma, sma(close,len_ma))
ma_long = exponential?f_secureSecurity(syminfo.tickerid, res_ma, ema(close,len_ma)) : f_secureSecurity(syminfo.tickerid, res_ma, sma(close,len_ma))

cl1 = f_secureSecurity(syminfo.tickerid, 'M', close)
cl2 = f_secureSecurity(tic_ma, 'M', close)

// Input Backtest Range
showDate  = input(defval = false, title = "Show Date Range", type = input.bool)
fromMonth = input(defval = 1,    title = "From Month",      type = input.integer, minval = 1, maxval = 12)
fromDay   = input(defval = 1,    title = "From Day",        type = input.integer, minval = 1, maxval = 31)
fromYear  = input(defval = 1995, title = "From Year",       type = input.integer, minval = 1850)
thruMonth = input(defval = 1,    title = "Thru Month",      type = input.integer, minval = 1, maxval = 12)
thruDay   = input(defval = 1,    title = "Thru Day",        type = input.integer, minval = 1, maxval = 31)
thruYear  = input(defval = 2112, title = "Thru Year",       type = input.integer, minval = 1850)

// Funcion Example
start     = timestamp(fromYear, fromMonth, fromDay, 00, 00)        // backtest start window
finish    = timestamp(thruYear, thruMonth, thruDay, 23, 59)        // backtest finish window
window()  => time >= start and time <= finish ? true : false       // create function "within window of time"

// Calculation
bullish_cross = ticker?cl2>ma_cus : cl1>ma_long
bearish_cross = ticker?cl2<ma_cus : cl1<ma_long

MAColor = bullish_cross ? color.green : bearish_cross ? color.red : color.orange

// Strategy
strategy.entry("long", strategy.long, when = window() and bullish_cross)
strategy.close("long", when = window() and bearish_cross)

// Output
plot(switch1?ma_long:na,color = MAColor,linewidth=4)

// Alerts
alertcondition(bullish_cross, title='Bullish', message='Bullish')
alertcondition(bearish_cross, title='Bearish', message='Bearish')