개요
이 전략의 핵심 아이디어는 동적 이동 평균을 사용하여 트렌드를 추적하고, 스톱 로드를 설정하고, 하이클링 기술 지시와 결합하여 다공간 신호 판단을 하는 것이다. ATR 지표는 동적 이동 평균과 스톱 로드를 계산하는 데 사용됩니다.
전략 원칙
이 전략은 먼저 ATR 지표를 계산한 다음, 입력된 가격 소스 및 파라미터를 결합하여 동적 이동 평균을 계산한다. 가격이 동적 이동 평균보다 높거나 낮을 때 더 많은/무슨 신호를 발생시킨다. 동시에 스톱 손실 스톱 위치를 설정하여 가격 변화에 대한 실시간 업데이트를 추적한다.
구체적으로, 먼저 ATR 지표와 변수 nLoss를 계산한다. 다음으로 현재 주기 가격과 이전 주기의 스톱 포지션을 계산하고, 둘을 비교하여 스톱 라인을 업데이트한다. 가격이 이전 주기 스톱 라인을 돌파할 때 더/무료 신호pos와 그에 따른 색상을 생성한다. 거래 신호가 생성될 때, 화살표 표시를 그리는다. 마지막으로 스톱 스톱 논리상 평지 포지션을 만든다.
우위 분석
이 전략의 가장 큰 장점은 동적 이동 평균을 사용하여 가격 변화를 실시간으로 추적한다는 것입니다. 이것은 전통적인 고정 이동 평균보다 트렌드를 포착하여 중단의 가능성을 감소시킵니다. 또한 ATR 중지와 결합하여 시장의 변동량에 따라 중단 위치를 유연하게 조정하여 위험을 효과적으로 제어 할 수 있습니다.
위험과 해결책
이 전략의 주요 위험은 가격이 큰 폭으로 상승할 수 있기 때문에 스톱 라인을 돌파하는 잘못된 신호가 발생한다. 또한, 조건 설정이 적절하지 않으면 너무 자주 거래될 수 있다.
해결책은 이동 평균 기간을 최적화하고 ATR 및 스톱 로프의 크기를 조정하여 잘못된 신호의 가능성을 줄이는 것입니다. 또한 필터링 조건을 설정하여 너무 밀도있는 거래를 피할 수 있습니다.
최적화 방향
이 전략은 다음과 같은 측면에서 최적화될 수 있습니다.
다양한 유형의 이동 평균을 테스트하고 최적의 변수 조합을 찾습니다.
ATR 사이클 파라미터를 최적화하여 스톱 로즈 민감도를 균형 잡는다.
추가 필터링 조건과 지표를 추가하여 신호 품질을 향상시킵니다.
정지값을 조정하여 수익 위험 비율을 최적화하십시오.
요약하다
이 전략의 핵심 아이디어는 동적 이동 평균으로 가격 변화를 실시간으로 추적하고, ATR 지표를 사용하여 동적으로 스톱 로즈를 설정하고, 트렌드를 추적하면서 위험을 엄격하게 제어하는 것입니다. 매개 변수 최적화 및 규칙 수정으로 이 전략을 매우 실용적인 정량화 시스템으로 훈련 할 수 있습니다.
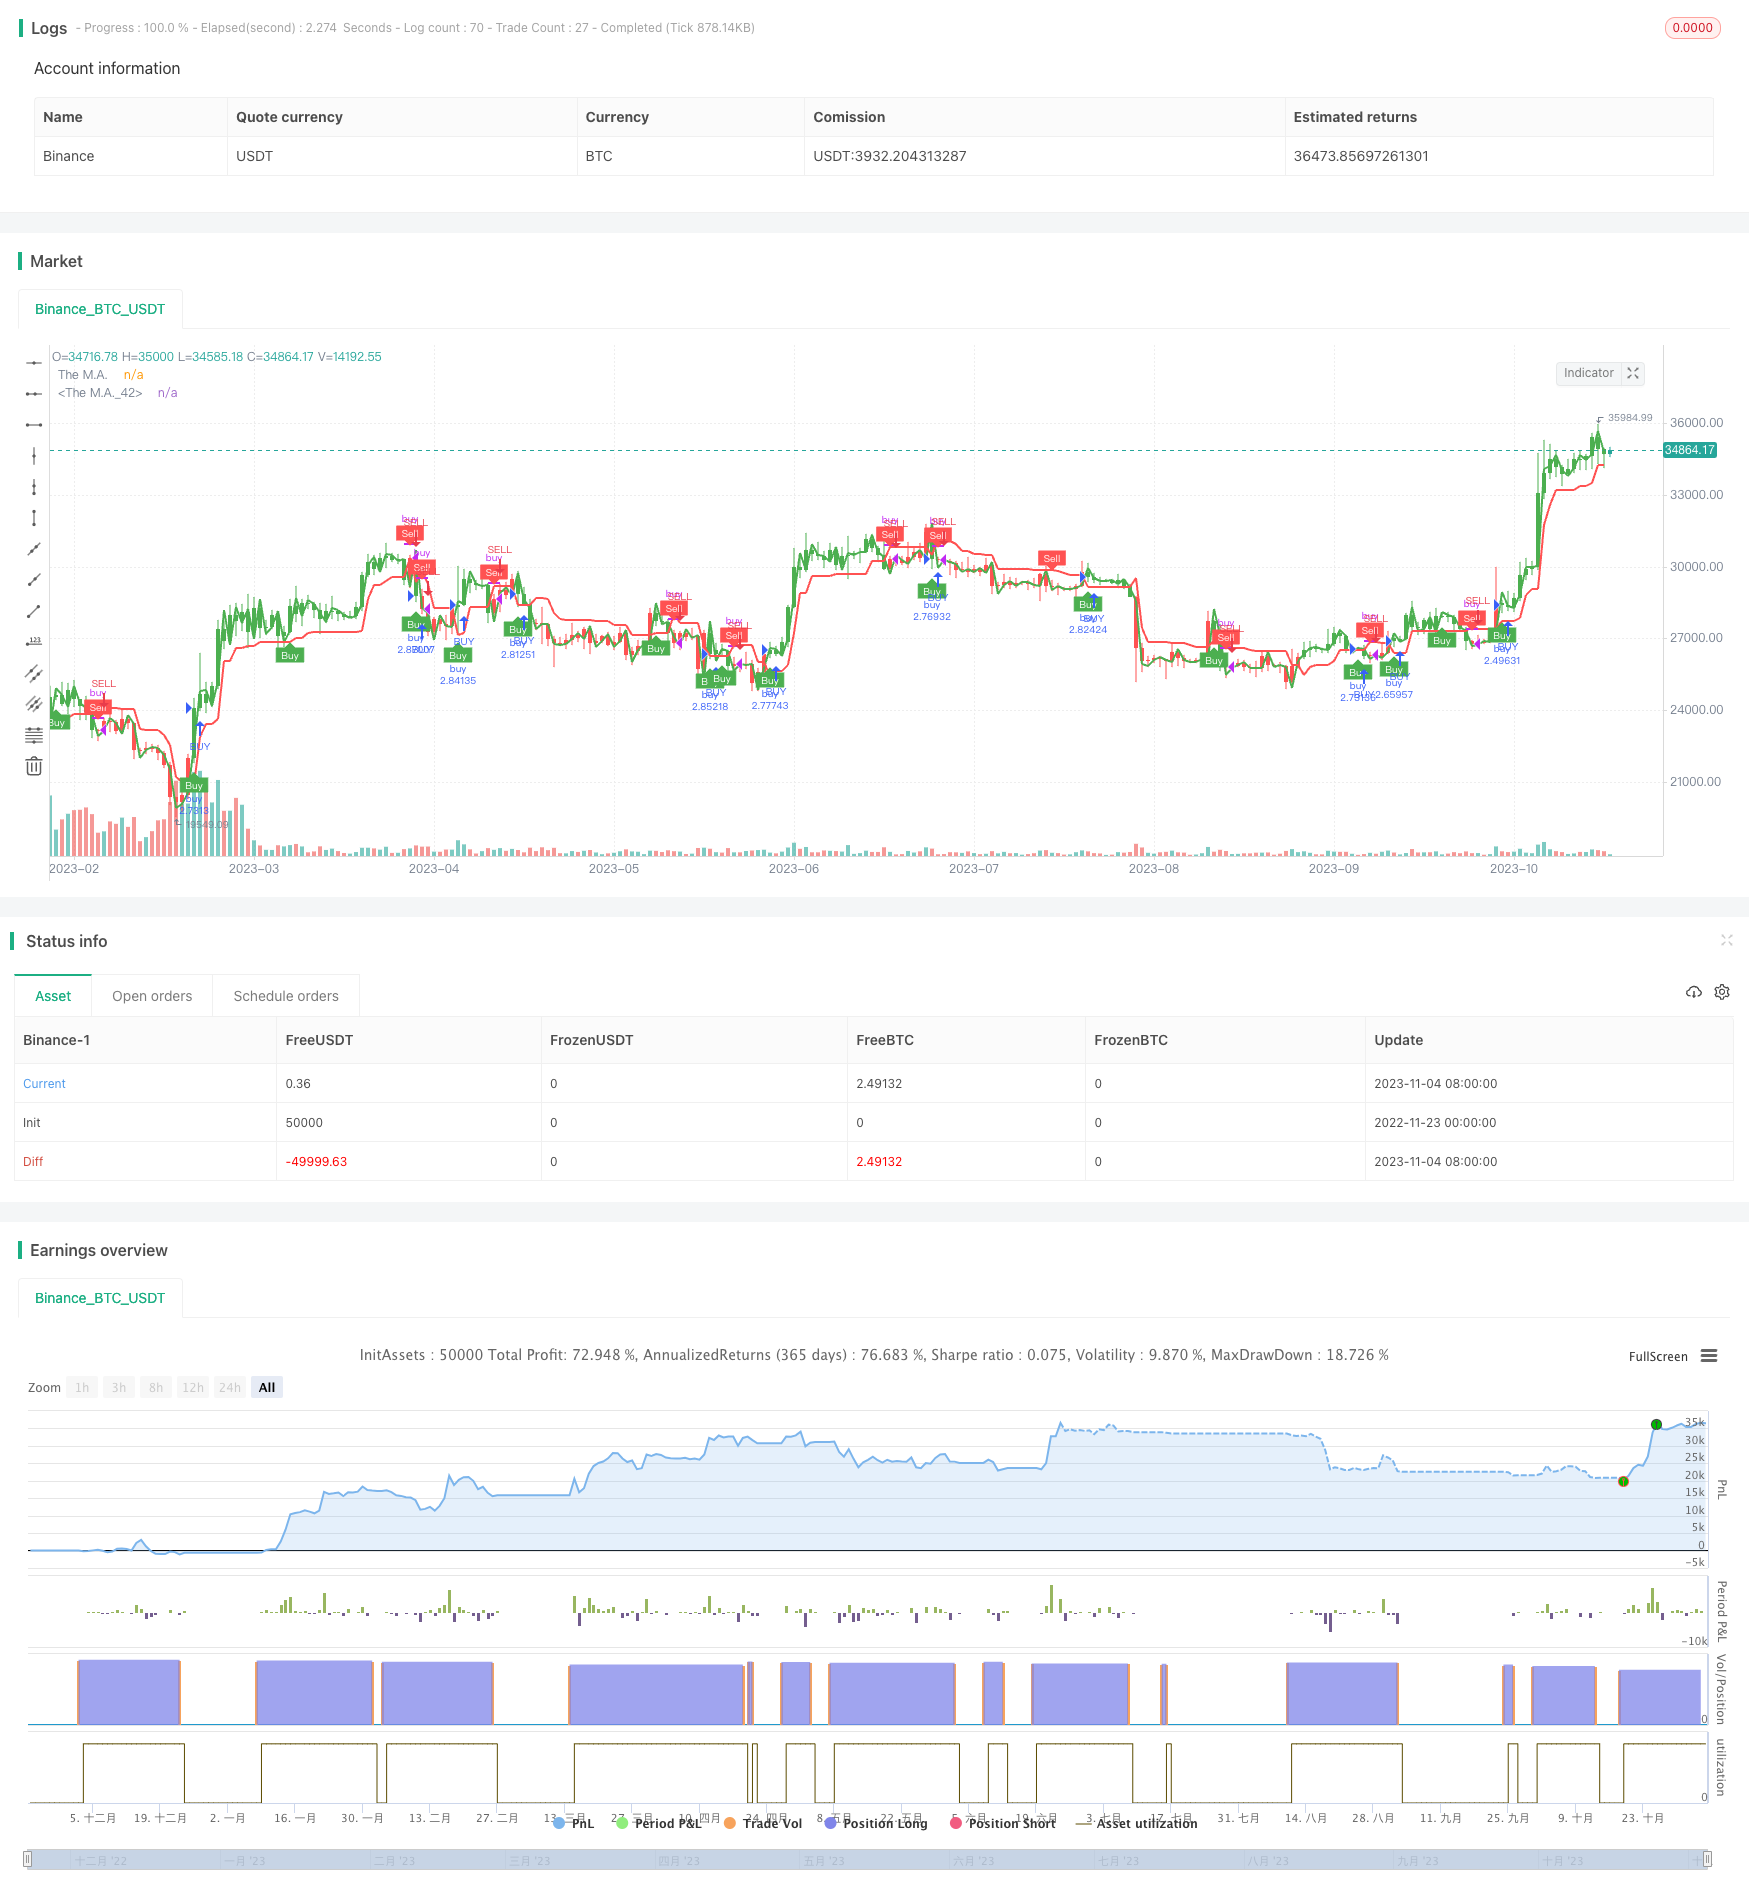
/*backtest
start: 2022-11-23 00:00:00
end: 2023-11-05 05:20:00
period: 1d
basePeriod: 1h
exchanges: [{"eid":"Binance","currency":"BTC_USDT","stocks":0}]
*/

//@version=5
strategy(title='UT Bot v5', overlay=true, default_qty_type=strategy.percent_of_equity, default_qty_value=100)
//CREDITS to HPotter for the orginal code. The guy trying to sell this as his own is a scammer lol.
//Edited and converted to @version=5 by SeaSide420 for Paperina
// Inputs
AllowBuy = input(defval=true, title='Allow Buy?')
AllowSell = input(defval=false, title='Allow Sell?')
h = input(false, title='Signals from Heikin Ashi Candles')
//revclose = input(defval=true, title='Close when reverse signal?')
Price = input(defval=open, title='Price Source (recommended OPEN to avoid repainting)')
smoothing = input.string(title="Moving Average Type", defval="HMA", options=["SMA", "EMA", "WMA", "HMA"])
MA_Period = input(2, title='This changes the MAPeriod')
a = input.float(1, title='This changes the sensitivity',step=0.1)
c = input(11, title='ATR Period')
TakeProfit = input.int(defval=50000, title='Take Profit ($)', minval=1)
StopLoss = input.int(defval=50000, title='Stop Loss ($)', minval=1)
xATR = ta.atr(c)
nLoss = a * xATR
src = h ? request.security(ticker.heikinashi(syminfo.tickerid), timeframe.period, Price, lookahead=barmerge.lookahead_off) : Price
xATRTrailingStop = 0.0
iff_1 = src > nz(xATRTrailingStop[1], 0) ? src - nLoss : src + nLoss
iff_2 = src < nz(xATRTrailingStop[1], 0) and src[1] < nz(xATRTrailingStop[1], 0) ? math.min(nz(xATRTrailingStop[1]), src + nLoss) : iff_1
xATRTrailingStop := src > nz(xATRTrailingStop[1], 0) and src[1] > nz(xATRTrailingStop[1], 0) ? math.max(nz(xATRTrailingStop[1]), src - nLoss) : iff_2
pos = 0
iff_3 = src[1] > nz(xATRTrailingStop[1], 0) and src < nz(xATRTrailingStop[1], 0) ? -1 : nz(pos[1], 0)
pos := src[1] < nz(xATRTrailingStop[1], 0) and src > nz(xATRTrailingStop[1], 0) ? 1 : iff_3
xcolor = pos == -1 ? color.red : pos == 1 ? color.green : color.blue
ma_function(src, MA_Period) =>
    switch smoothing
        "SMA" => ta.sma(src, MA_Period)
        "EMA" => ta.ema(src, MA_Period)
        "WMA" => ta.wma(src, MA_Period)
        => ta.hma(src, MA_Period)
thema = ma_function(src, MA_Period)
above = ta.crossover(thema, xATRTrailingStop)
below = ta.crossover(xATRTrailingStop, thema)
buy = src > xATRTrailingStop and above
sell = src < xATRTrailingStop and below
barbuy = src > xATRTrailingStop
barsell = src < xATRTrailingStop
plot(thema,title="The M.A.",color=color.green,linewidth=2)
plot(xATRTrailingStop,title="The M.A.",color=color.red,linewidth=2)
plotshape(buy,  title = "Buy",  text = "Buy",  style = shape.labelup,   location = location.belowbar, color= color.green, textcolor = color.white, size = size.tiny)
plotshape(sell, title = "Sell", text = "Sell", style = shape.labeldown, location = location.abovebar, color= color.red,   textcolor = color.white, size = size.tiny)
barcolor(barbuy ? color.green : na)
barcolor(barsell ? color.red : na)
strategy.close_all(when=strategy.openprofit>TakeProfit,alert_message="Close- TakeProfit", comment = "TP")
strategy.close_all(when=strategy.openprofit<StopLoss-(StopLoss*2),alert_message="Close- StopLoss", comment = "SL")
strategy.close("buy", when =  sell and AllowSell==false , comment = "close buy")
strategy.close("sell", when =  buy and AllowBuy==false, comment = "close sell")
strategy.entry("buy", strategy.long, when = buy and AllowBuy)
strategy.entry("sell", strategy.short, when = sell and AllowSell)