개요
트렌드 서핑 (TrendSurfing) 전략은 쌍평선 교차를 주요 거래 신호로 하는 트렌드 추적 전략이다. 그것은 동시에 삼각형 시각 지표, 200일 EMA, ROC 지표 및 RSI 지표를 결합하여 잡음을 필터링하고, 트렌드 전환점에서 새로운 트렌드 방향을 정확하게 포착한다. 이 전략은 중장선 지위를 유지하는 데 적합하며, 황소 시장에서 안정적인 성장을 얻을 수 있다.
전략 원칙
트렌드 서핑 전략은 주로 빠른 이동 평균과 느린 이동 평균의 금 叉 死 叉 를 기반으로 구매 및 판매 신호를 형성한다. 빠른 이동 평균 상에서 느린 이동 평균을 통과 할 때 구매 신호를 생성; 빠른 이동 평균 아래에서 느린 이동 평균을 통과 할 때 판매 신호를 생성한다.
또한, 이 전략은 가짜 신호를 필터링하거나 트렌드 품질을 결정하기 위해 여러 보조 지표를 도입했습니다. 구체적으로:
- ROC 지표는 가격 변화의 경향과 속도를 판단합니다.
- RSI 지표가 과매매 영역에 있는지 판단하는 방법
- 200일 EMA가 전체적인 추세 방향에 대해 판단한다
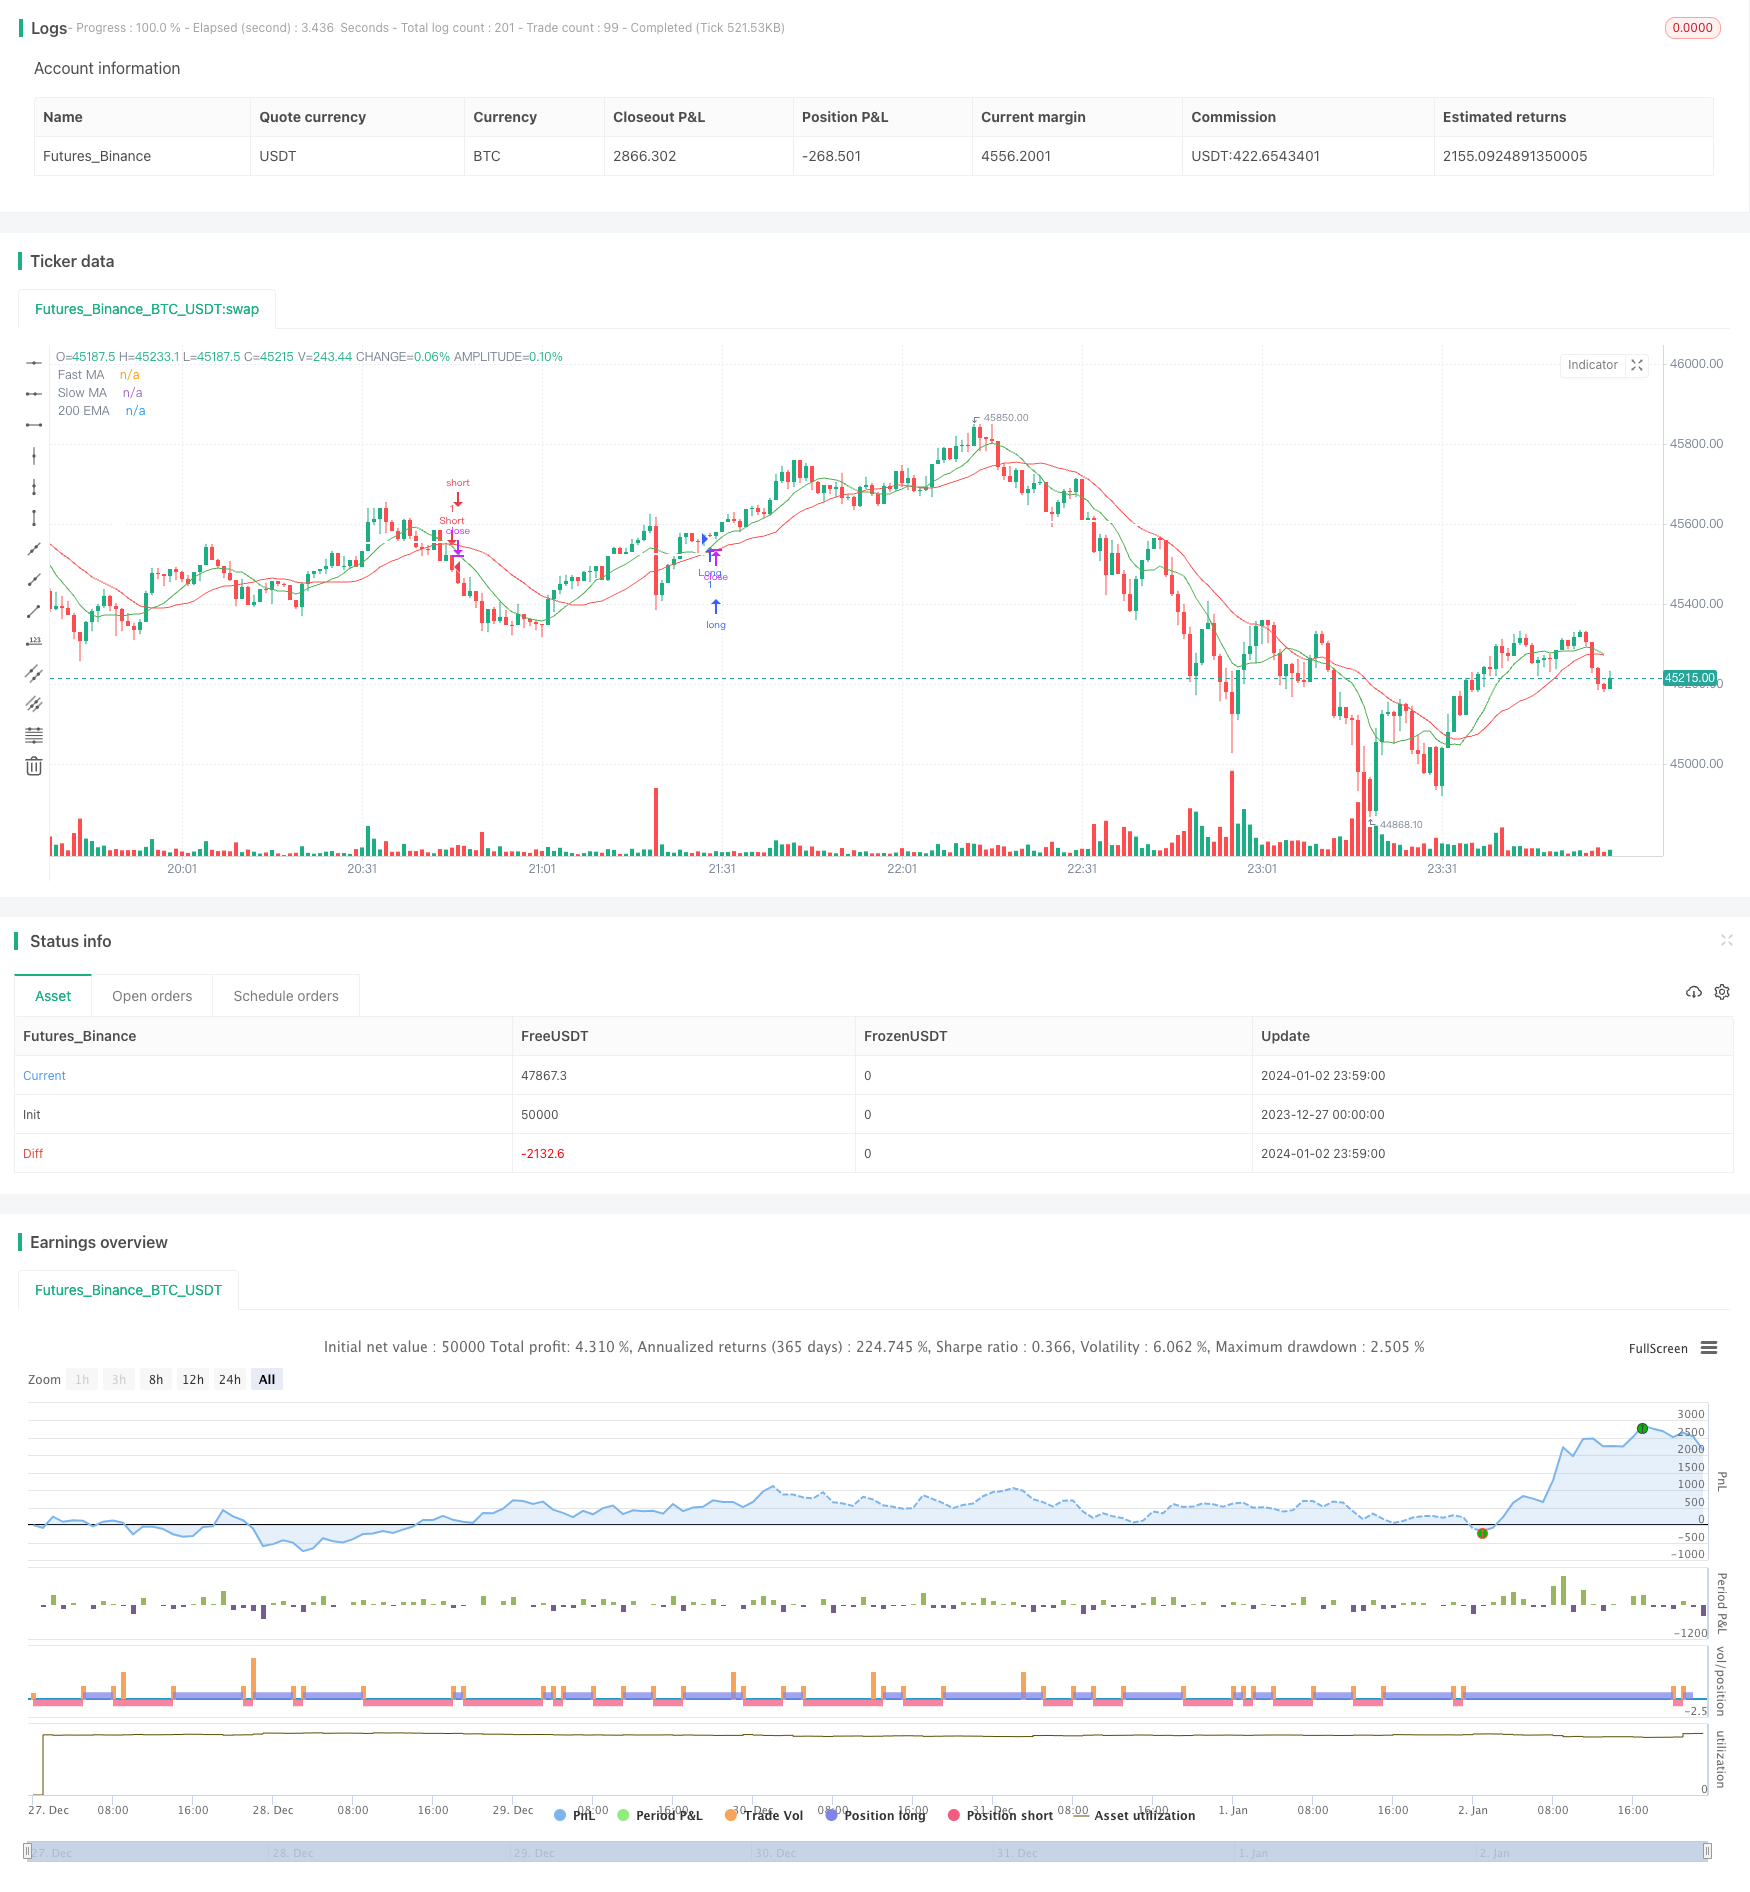
- 삼각형 시각 지표가 도표에 입력 지점을 표시합니다.
다중 지표 통합 판단을 통해, 트렌드 서핑 전략은 트렌드 전환점을 정확하게 파악하고, 긴 선에서 명확한 트렌드를 추적하고, 시장 소음이나 짧은 선 조정으로 오해하지 않습니다.
우위 분석
1. 명확한 트렌드를 잡기
이 전략은 평균선 교차를 통해 기본적인 판단 트렌드 전환점을 통해 200일 EMA와 같은 지표가 짧은 선의 소음을 필터링하고, 중간에 긴 선의 트렌드를 파악하는 데 집중한다.
2. 고품질 입학을 확인하는 다중 지표 조합
평행선 크로스 자체 외에도, 이 전략은 ROC, RSI 등의 지표를 도입하여 트렌드 전환점에서의 흔들림 영역을 피하여 진입 품질을 보장합니다.
3. 직관적으로 읽기 쉬운 삼각형 시각 지표
초록색의 아래로 향하는 삼각형이 구매 시기를 표시하고, 빨간색의 위로 향하는 삼각형이 판매 시기를 표시합니다.
4. 다양한 요구에 맞게 사용자 정의 가능한 변수
사용자들은 자신의 거래 스타일에 맞게 평균선 변수, ROC 길이, RSI 길이 등을 자유롭게 조정할 수 있다.
5. 손해 방지 관리 이 전략은 ATR 값을 위험 비율에 곱하여 단 거래의 위험을 제어하는 중지 손실 및 중지 위치를 사용합니다.
위험 분석
1. 유출 위험
평행선 교차를 기반으로 한 모든 전략은 평행선 흔들림에 따라 발생하는 특정 누락권 또는 중지 손실 위험에 직면합니다.
2. 잘못 설정된 파라미터는 과잉 최적화로 이어질 수 있습니다.
사용자는 표준 매개 변수를 추구하는 것을 피하고 지표 수치를 지나치게 이상적으로 설정한다. 다른 시장 상황과 품종에 따라 매개 변수 테스트를 해야 한다.
3. 시장의 체계적 위험 사건을 전체적으로 필터링할 수 없습니다. 그러나, Black Swan 사건과 같은 극단적인 상황에서는 여전히 큰 손실이 발생할 수 있습니다.
최적화 방향
1. 테스트 및 최적화 매개 변수 설정
평균선주기, ROC 길이, RSI 변수 등이 재검토되고 최적화되어 서로 다른 거래 품종의 특성에 더 잘 맞도록 해야 한다.
2. 테스트하고 다른 보조 지표를 도입합니다.
BOLL, KDJ 등 다른 지표와 평균선 교차의 조합 효과를 테스트할 수 있다.
3. 알고리즘 거래와 결합된 스톱 스톱 손실 최적화
기계 학습 알고리즘을 도입하여 스톱 스톱을 더욱 지능화하고, 역동적인 변화하는 시장 환경에 적응할 수 있도록 한다.
4. 다른 전략이나 모델들과의 조합을 탐구한다.
기본 주식 선택 전략, 통계적 중개 전략, 투자 포트폴리오 최적화 모델 등과 결합하여 수익률을 높이기 위해 위험을 더욱 제어 할 수 있습니다.
요약하다
트렌드 서핑 (TrendSurfing) 전략은 간단하고 직접적이며, 위험을 제어할 수 있는 트렌드 추적 전략이다. 이 트렌드 서핑은 쌍평평선 교차로 형성된 거래 신호를 중심으로 펼쳐지며, 여러 가지 보조 지표로 필터링된다. 이 전략은 중장선 포지션에 적합하며, 황소 시장의 흐름을 안정적으로 추적할 수 있다. 우리는 변수 테스트, 지표 확장, 위험 제어 등의 수단으로 이 전략에 대한 최적화를 계속할 것이며, 더 넓은 시장에서 더 안정적인 성능을 얻을 수 있다.
||
Overview
The TrendSurfing strategy is a trend tracking strategy based primarily on double moving average crossover signals. It also incorporates triangle visual indicators, 200-day EMA, ROC indicator and RSI indicator to filter out noise and accurately capture trend reversals. This strategy is suitable for medium-to-long-term holding and can achieve steady growth in a bull market.
Strategy Logic
The TrendSurfing strategy mainly relies on golden cross and death cross formed by fast moving average and slow moving average to generate buy and sell signals. When the fast MA crosses above the slow MA, a buy signal is generated. When the fast MA crosses below the slow MA, a sell signal is generated.
In addition, the strategy incorporates several auxiliary indicators to filter out false signals or determine trend quality, including:
- ROC indicator to determine price trend and momentum
- RSI oscillator to detect overbought/oversold levels
- 200-day EMA to determine overall trend direction
- Triangle visual indicators to mark entry points on chart
By comprehensively judging various indicators, the TrendSurfing strategy can accurately locate trend turning points and track definite medium-to-long term trends without being misguided by market noise or short-term corrections.
Advantage Analysis
1. Catch Medium-to-Long Term Trend
The strategy basically judges trend reversal based on MA crosses, and uses indicators like 200-day EMA to filter out short-term noise, with focus on medium-to-long term trend capture.
2. Multiple Indicators Ensure High Quality Entry
On top of MA crossover itself, the incorporation of ROC, RSI and other indicators enables avoidance of consolidation zones on reversal points and ensures quality entry.
3. Intuitive Triangle Visual Indicators
Green downward triangles indicate long entries, red upward triangles indicate short entries. Clean and straightforward.
4. Customizable Parameters for Different Needs
Users can freely adjust parameters like MA periods, ROC length, RSI length etc according to their own trading style.
5. Stop Loss and Take Profit Control
The strategy sets stop loss and take profit based on ATR value multiplied by risk percentage, enabling per trade risk control.
Risk Analysis
1. Risk of Missing Trades
Any MA crossover based strategy has inherent risk of missing trades or being stopped out when MA is oscillating.
2. Over-optimization from Improper Parameter Settings Users should avoid chasing hypothetically ideal parameter values. Parameters should be tested and adapted based on different market conditions and products.
3. Inability to Fully Filter Black Swan Events
Under extreme market conditions, strategies could still face large losses from market systemic risks.
Optimization Directions
1. Test and Optimize Parameter Values
Periods of MAs, length of ROC, values of RSI etc should go through rigorous backtesting and optimization to fit characteristics of different trading products.
2. Test and Incorporate Other Auxiliary Indicators
Continue testing combinations of other indicators like BOLL, KDJ etc with MA crosses for better performance.
3. Coordinate with Algorithmic Trading for Better Risk Control Introduce machine learning algorithms to enable more intelligent stop loss and take profit, adapting to dynamic market environments.
4. Explore Combinations with Other Strategies or Models
Combining with fundamentals-based stock picking strategies, statistical arbitrage strategies, portfolio optimization models etc could further enhance risk control and return.
Conclusion
The TrendSurfing strategy is a simple, straightforward trend tracking strategy with controllable risk. Trading signals are generated from MA crosses and filtered by multiple auxiliary indicators. It is suitable for medium-to-long term holding to steadily track bull market trends. We will continue optimizing this strategy through parameter testing, indicator expansion, risk control etc to achieve more reliable performance across diverse markets.
[/trans]
/*backtest
start: 2023-12-27 00:00:00
end: 2024-01-03 00:00:00
period: 1m
basePeriod: 1m
exchanges: [{"eid":"Futures_Binance","currency":"BTC_USDT"}]
*/

//@version=4
strategy("Moving Average Crossover with Triangles, 200 EMA, ROC, and RSI", overlay=true)

// Define input parameters
fast_length = input(9, title="Fast MA Length")
slow_length = input(21, title="Slow MA Length")
roc_length = input(14, title="ROC Length")
rsi_length = input(14, title="RSI Length")

// Calculate moving averages
fast_ma = sma(close, fast_length)
slow_ma = sma(close, slow_length)

// Plot moving averages
plot(fast_ma, color=color.green, title="Fast MA")
plot(slow_ma, color=color.red, title="Slow MA")

// Plot 200 EMA
ema_200 = ema(close, 200)
plot(ema_200, color=color.white, title="200 EMA", linewidth=2)

// Calculate Rate of Change (ROC)
roc = roc(close, roc_length)

// Calculate RSI
rsi = rsi(close, rsi_length)

// Define strategy entry and exit conditions
long_condition = crossover(fast_ma, slow_ma) and roc > 0 and close > ema_200 and rsi > 55
short_condition = crossunder(fast_ma, slow_ma) and roc < 0 and close < ema_200 and rsi < 45

// Execute strategy
strategy.entry("Long", strategy.long, when=long_condition)
strategy.entry("Short", strategy.short, when=short_condition)

// Define stop loss and take profit levels
risk_percent = input(1, title="Risk Percentage", minval=0.1, maxval=5, step=0.1) / 100
atr_value = atr(14)
stop_loss = close - atr_value * risk_percent
take_profit = close + atr_value * risk_percent

strategy.exit("Take Profit/Stop Loss", from_entry="Long", loss=stop_loss, profit=take_profit)
strategy.exit("Take Profit/Stop Loss", from_entry="Short", loss=stop_loss, profit=take_profit)

// Plot larger triangles on crossover and crossunder
plotshape(series=long_condition, title="Long Entry", color=color.green, style=shape.triangleup, location=location.belowbar, size=size.small)
plotshape(series=short_condition, title="Short Entry", color=color.red, style=shape.triangledown, location=location.abovebar, size=size.small)