개요
양자 이중 요인 역 역 역 역전성 거래 전략 (Quant Dual Factor Reversal Inertia Trading Strategy) 은 가격 역전 신호와 시장 역전성 신호를 결합한 양자 거래 전략이다. 이 전략은 우선 가격 역전 신호를 실현하기 위해 무작위 지표를 사용하다가 상대적인 변동률 지표의 시장 역전성 신호를 결합하여 결국 쌍 요인 동력 거래 결정을 실현한다.
전략 원칙
이 전략은 크게 두 가지로 구성되어 있습니다.
가격 반전이 부분적으로 울프 센 (Ulf Jensen) 이 그의 저서에서 제시한 생각을 채택합니다. 구체적으로: 2 일 연속으로 상향을 향하고 9 일 연속으로 느린 스토카스틱 지표가 50보다 낮을 때 더 많이; 2 일 연속으로 상향을 향하고 9 일 연속으로 빠른 스토카스틱 지표가 50보다 낮을 때, 공백을 만든다.
시장의 역동적인 부분은 상대적 변동률 지표 ((RVI) 를 사용합니다. 이 지표 값은 0에서 100 사이에 변동하며, 50 이상은 시장의 장기적 추세가 상승한 것을 나타냅니다. 50 이하는 시장의 장기적 추세가 하락한 것을 나타냅니다.
종합적으로, 이 전략은 가격 역전 신호와 시장 관성 신호를 통합하여 현재 시장의 방향을 결정한다. 두 신호가 일치하면 거래 신호를 생성한다.
우위 분석
이 전략의 가장 큰 장점은 역전과 트렌드 두 가지의 거래 사고방식을 결합한다는 것입니다. 역전 신호는 단기간의 조정을 포착하여 거래 기회를 제공합니다. 관성 신호는 장기적인 추세와 일치하는 경우에만 포지션을 열고 잡음을 효과적으로 필터링 할 수 있습니다.
또한, 이중 인자 드라이브는 신호 품질을 향상시킬 수 있으며, 스토카스틱 지표 변수 최적화 및 RVI 부드러운 최적화도 전략 최적화에 대한 공간을 제공합니다.
위험 분석
이 전략의 주요 위험은 다음과 같습니다.
역전 신호의 부정확한 식별 위험. 파라미터가 합리적인지 검증해야 한다.
관성 신호는 잘못된 신호를 발산할 위험이 있다. RVI 지표 자체는 지연되어 평형 매개 변수를 조정할 필요가 있다.
이중인자 신호 시간 일치가 부적절하여 거래 기회를 놓칠 위험이 있다. 다양한 매개 변수 아래의 일치 상황을 테스트할 필요가 있다.
또한, 반전 전략은 트렌드 시장 하에서 손실이 증가할 위험이 있다.
최적화 방향
이 전략은 다음과 같은 부분에서 최적화될 수 있습니다.
Stochastic 지표의 매개 변수를 최적화하여 역전 신호의 품질과 적시에 대해 알아본다.
RVI 지표의 평형 변수를 최적화하여 관성 판단의 정확성을 향상시킨다.
포지션 보유 시간을 테스트하여 최적의 포지션 기간을 결정한다.
스피드 메커니즘에 참여한다. 다양한 스피드 포인트를 재검토하여 최적의 스피드 위치를 찾는다.
다른 요소 신호를 추가하는 것이 고려될 수 있습니다. 예를 들어 거래량 변동과 같은, 다중 요소 드라이브를 형성한다.
요약하다
양자적 이중인자 역전 관성 거래 전략은 역전과 트렌드 인자를 종합적으로 고려하고, 스토카스틱 지표와 RVI 지표를 사용하여 거래 신호를 생성한다. 전략은 이중인자 드라이브, 역전 기회 포착 및 신호 필터링 등의 장점을 가지고 있으며, 다방면 파라미터 최적화를 통해 추가적으로 개선할 수 있다. 위험 제어 또한 특히 중요하며, 엄격하게 중지 할 필요가 있다. 이 전략은 양자적 거래에 대한 좋은 아이디어를 제공합니다.
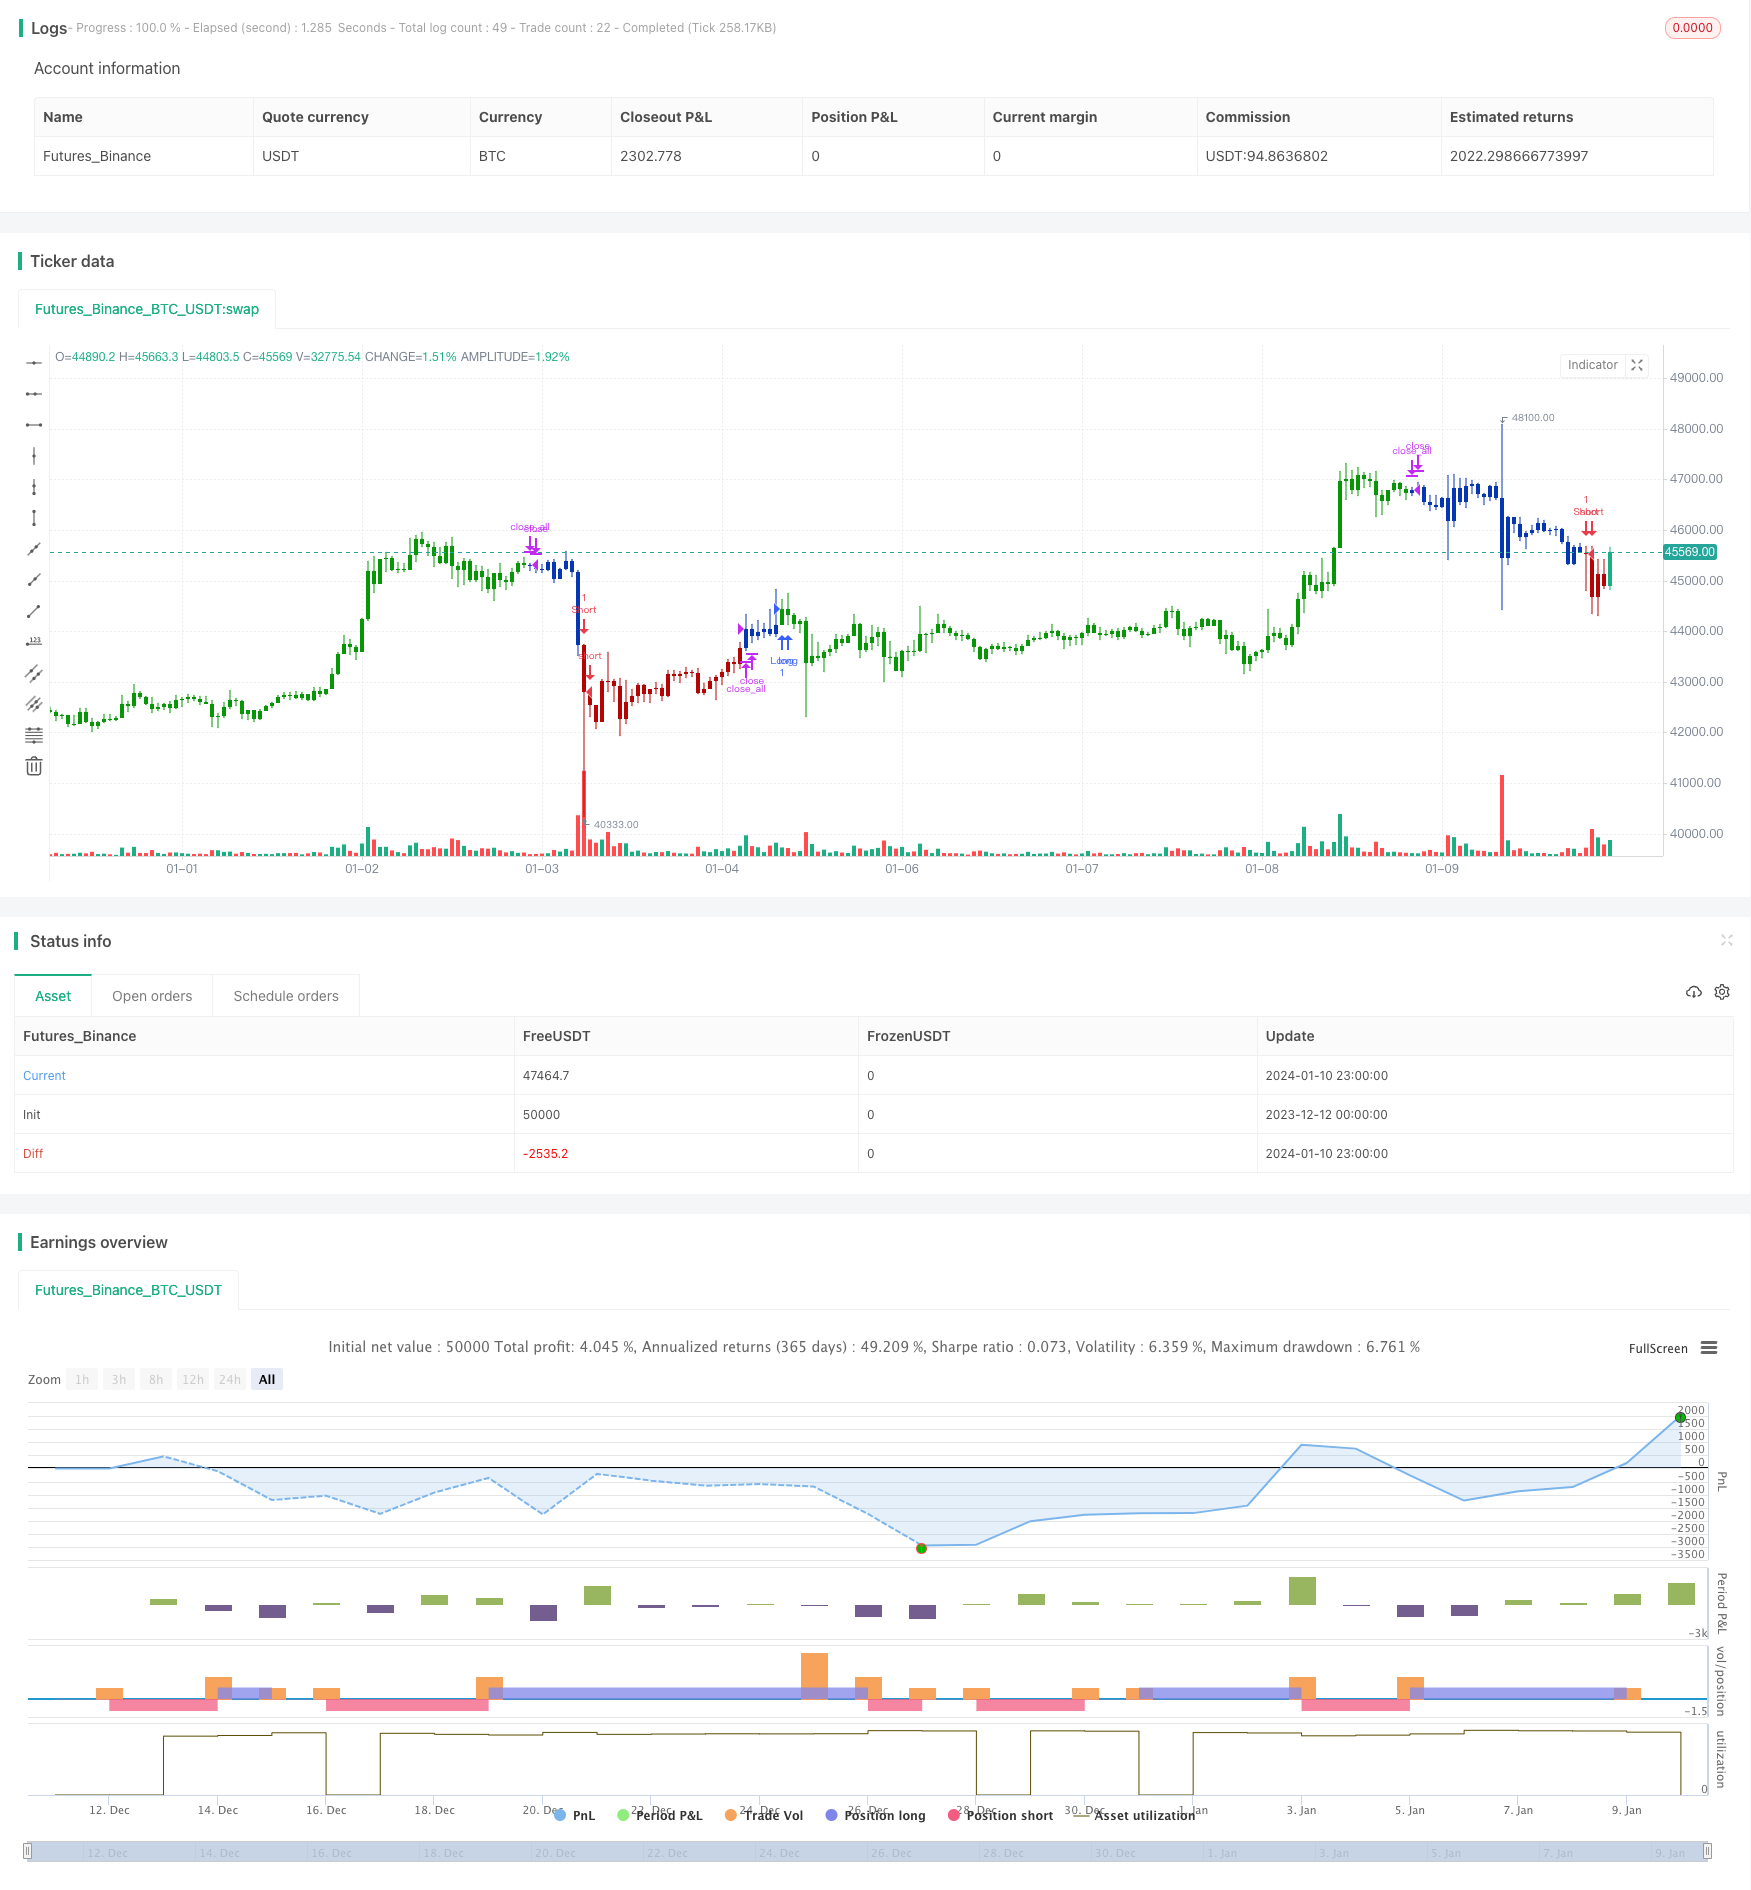
/*backtest
start: 2023-12-12 00:00:00
end: 2024-01-11 00:00:00
period: 1h
basePeriod: 15m
exchanges: [{"eid":"Futures_Binance","currency":"BTC_USDT"}]
*/

//@version=4
////////////////////////////////////////////////////////////
//  Copyright by HPotter v1.0 27/11/2020
// This is combo strategies for get a cumulative signal.
//
// First strategy
// This System was created from the Book "How I Tripled My Money In The
// Futures Market" by Ulf Jensen, Page 183. This is reverse type of strategies.
// The strategy buys at market, if close price is higher than the previous close
// during 2 days and the meaning of 9-days Stochastic Slow Oscillator is lower than 50.
// The strategy sells at market, if close price is lower than the previous close price
// during 2 days and the meaning of 9-days Stochastic Fast Oscillator is higher than 50.
//
// Second strategy
// The inertia indicator measures the market, stock or currency pair momentum and
// trend by measuring the security smoothed RVI (Relative Volatility Index).
// The RVI is a technical indicator that estimates the general direction of the
// volatility of an asset.
// The inertia indicator returns a value that is comprised between 0 and 100.
// Positive inertia occurs when the indicator value is higher than 50. As long as
// the inertia value is above 50, the long-term trend of the security is up. The inertia
// is negative when its value is lower than 50, in this case the long-term trend is
// down and should stay down if the inertia stays below 50.
//
// You can change long to short in the Input Settings
// Please, use it only for learning or paper trading. Do not for real trading.
//
// WARNING:
// - For purpose educate only
// - This script to change bars colors.
////////////////////////////////////////////////////////////
Reversal123(Length, KSmoothing, DLength, Level) =>
    vFast = sma(stoch(close, high, low, Length), KSmoothing)
    vSlow = sma(vFast, DLength)
    pos = 0.0
    pos := iff(close[2] < close[1] and close > close[1] and vFast < vSlow and vFast > Level, 1,
	         iff(close[2] > close[1] and close < close[1] and vFast > vSlow and vFast < Level, -1, nz(pos[1], 0)))
	pos

Inertia(Period, Smooth) =>
    pos = 0.0
    nU = 0.0
    nD = 0.0
    xPrice = close
    StdDev = stdev(xPrice, Period)
    d = iff(close > close[1], 0, StdDev)
    u = iff(close > close[1], StdDev, 0)
    nU := (13 * nz(nU[1],0) + u) / 14
    nD := (13 * nz(nD[1],0) + d) / 14
    nRVI = 100 * nU / (nU + nD)
    nRes = ema(nRVI, Smooth)
    pos :=iff(nRes > 50, 1,
    	   iff(nRes < 50, -1, nz(pos[1], 0)))
    pos

strategy(title="Combo Backtest 123 Reversal & Inertia Strategy", shorttitle="Combo", overlay = true)
Length = input(14, minval=1)
KSmoothing = input(1, minval=1)
DLength = input(3, minval=1)
Level = input(50, minval=1)
//-------------------------
Period = input(10, minval=1)
Smooth = input(14, minval=1)
reverse = input(false, title="Trade reverse")
posReversal123 = Reversal123(Length, KSmoothing, DLength, Level)
posInertia = Inertia(Period, Smooth)
pos = iff(posReversal123 == 1 and posInertia == 1 , 1,
	   iff(posReversal123 == -1 and posInertia == -1, -1, 0))
possig = iff(reverse and pos == 1, -1,
          iff(reverse and pos == -1 , 1, pos))
if (possig == 1)
    strategy.entry("Long", strategy.long)
if (possig == -1)
    strategy.entry("Short", strategy.short)
if (possig == 0)
    strategy.close_all()
barcolor(possig == -1 ? #b50404: possig == 1 ? #079605 : #0536b3 )