개요
이것은 3개의 지수 이동 평균 ((EMA), 트렌드 지표 ((DMI) 와 이동 평균 집적 지표 ((MACD) 를 사용하여 트렌드 방향을 결정하고 매매 신호를 생성하는 트렌드 추적 전략이다. 핵심 구성 요소는 EMA 금 교차 신호, DMI는 트렌드 강도를 판단하고 MACD는 동력을 확인한다.
전략 논리
핵심 논리는 M5 주기에 계산된 3개의 EMA (34, 89, 200) 에 의존하여 전체적인 트렌드를 식별한다. 34주기 EMA는 근기간의 방향을 제공하며, 89과 200의 EMA는 중장기적인 트렌드를 정의한다.
신호를 구매할 때
- 34 EMA를 기록한 종전 가격
- +DI (( 경향 운동) > 17
- ADX (트렌드 강도) > -DI
판매 신호 생성 시:
- 34 EMA를 넘어서
- -DI ((하향 경향 운동) > 17
- ADX > +DI
입학 전에 MACD 지표가 추가 확인을 제공합니다.
장점
이 전략에는 몇 가지 중요한 장점이 있습니다.
- 단기 EMA 금의 교차와 조기 포착 트렌드 전환
- 여러 EMA를 사용하여 다른 시간 프레임의 트렌드 강도를 판단합니다.
- DMI 필터는 강력한 트렌드 운동을 검사하여 잘못된 신호를 피하는 데 도움이됩니다.
- MACD는 트레이딩 기회의 질과 확률을 높이는 동력 확인을 제공합니다.
- 지표의 조합은 진입 신호의 정확성과 타이밍을 향상시킵니다.
위험
주요 위험요소:
- 오로지 EMA 골드 크로스에 의존하는 것은 오도 및 잘못된 위치에 영향을 받을 수 있습니다.
- 복수의 확인은 신호 생성 시점의 지연을 초래할 수 있습니다.
- 급격한 트렌드 반향에 취약하다
어떻게 완화할 수 있을까요?
- 적절한 스톱 로즈 및 포지션 관리
- 현재 시장 조건에 따라 EMA 매개 변수를 최적화
- 시각적 인 확인을 위해 가격 실물 움직임을 관찰하십시오.
최적화 방향
전략의 추가 개선:
- RSI와 같은 지표가 증가하여 과매도 영역을 판단합니다.
- 합성 교통량 분석으로 더 강력한 신호를 생성한다.
- 다른 자산과 시간 프레임에 따라 지표와 매개 변수를 최적화합니다.
- 새로운 시장 데이터로부터 계속 학습하는 기계 학습 기술을 적용합니다.
요약하다
전체적으로 볼 때, 이것은 강력한 트렌드 추적 시스템으로, 간단한 그러나 실용적인 몇 가지 지표의 순서를 사용하여 3 개의 EMA를 구성하여 여러 시간 프레임의 트렌드를 판단하고, DMI와 MACD는 진입 시기와 수익 가능성을 향상시킵니다. 적절한 최적화 및 위험 관리와 함께, 트렌드 거래자의 효과적인 이득 도구가 될 수 있습니다.
전략 소스 코드
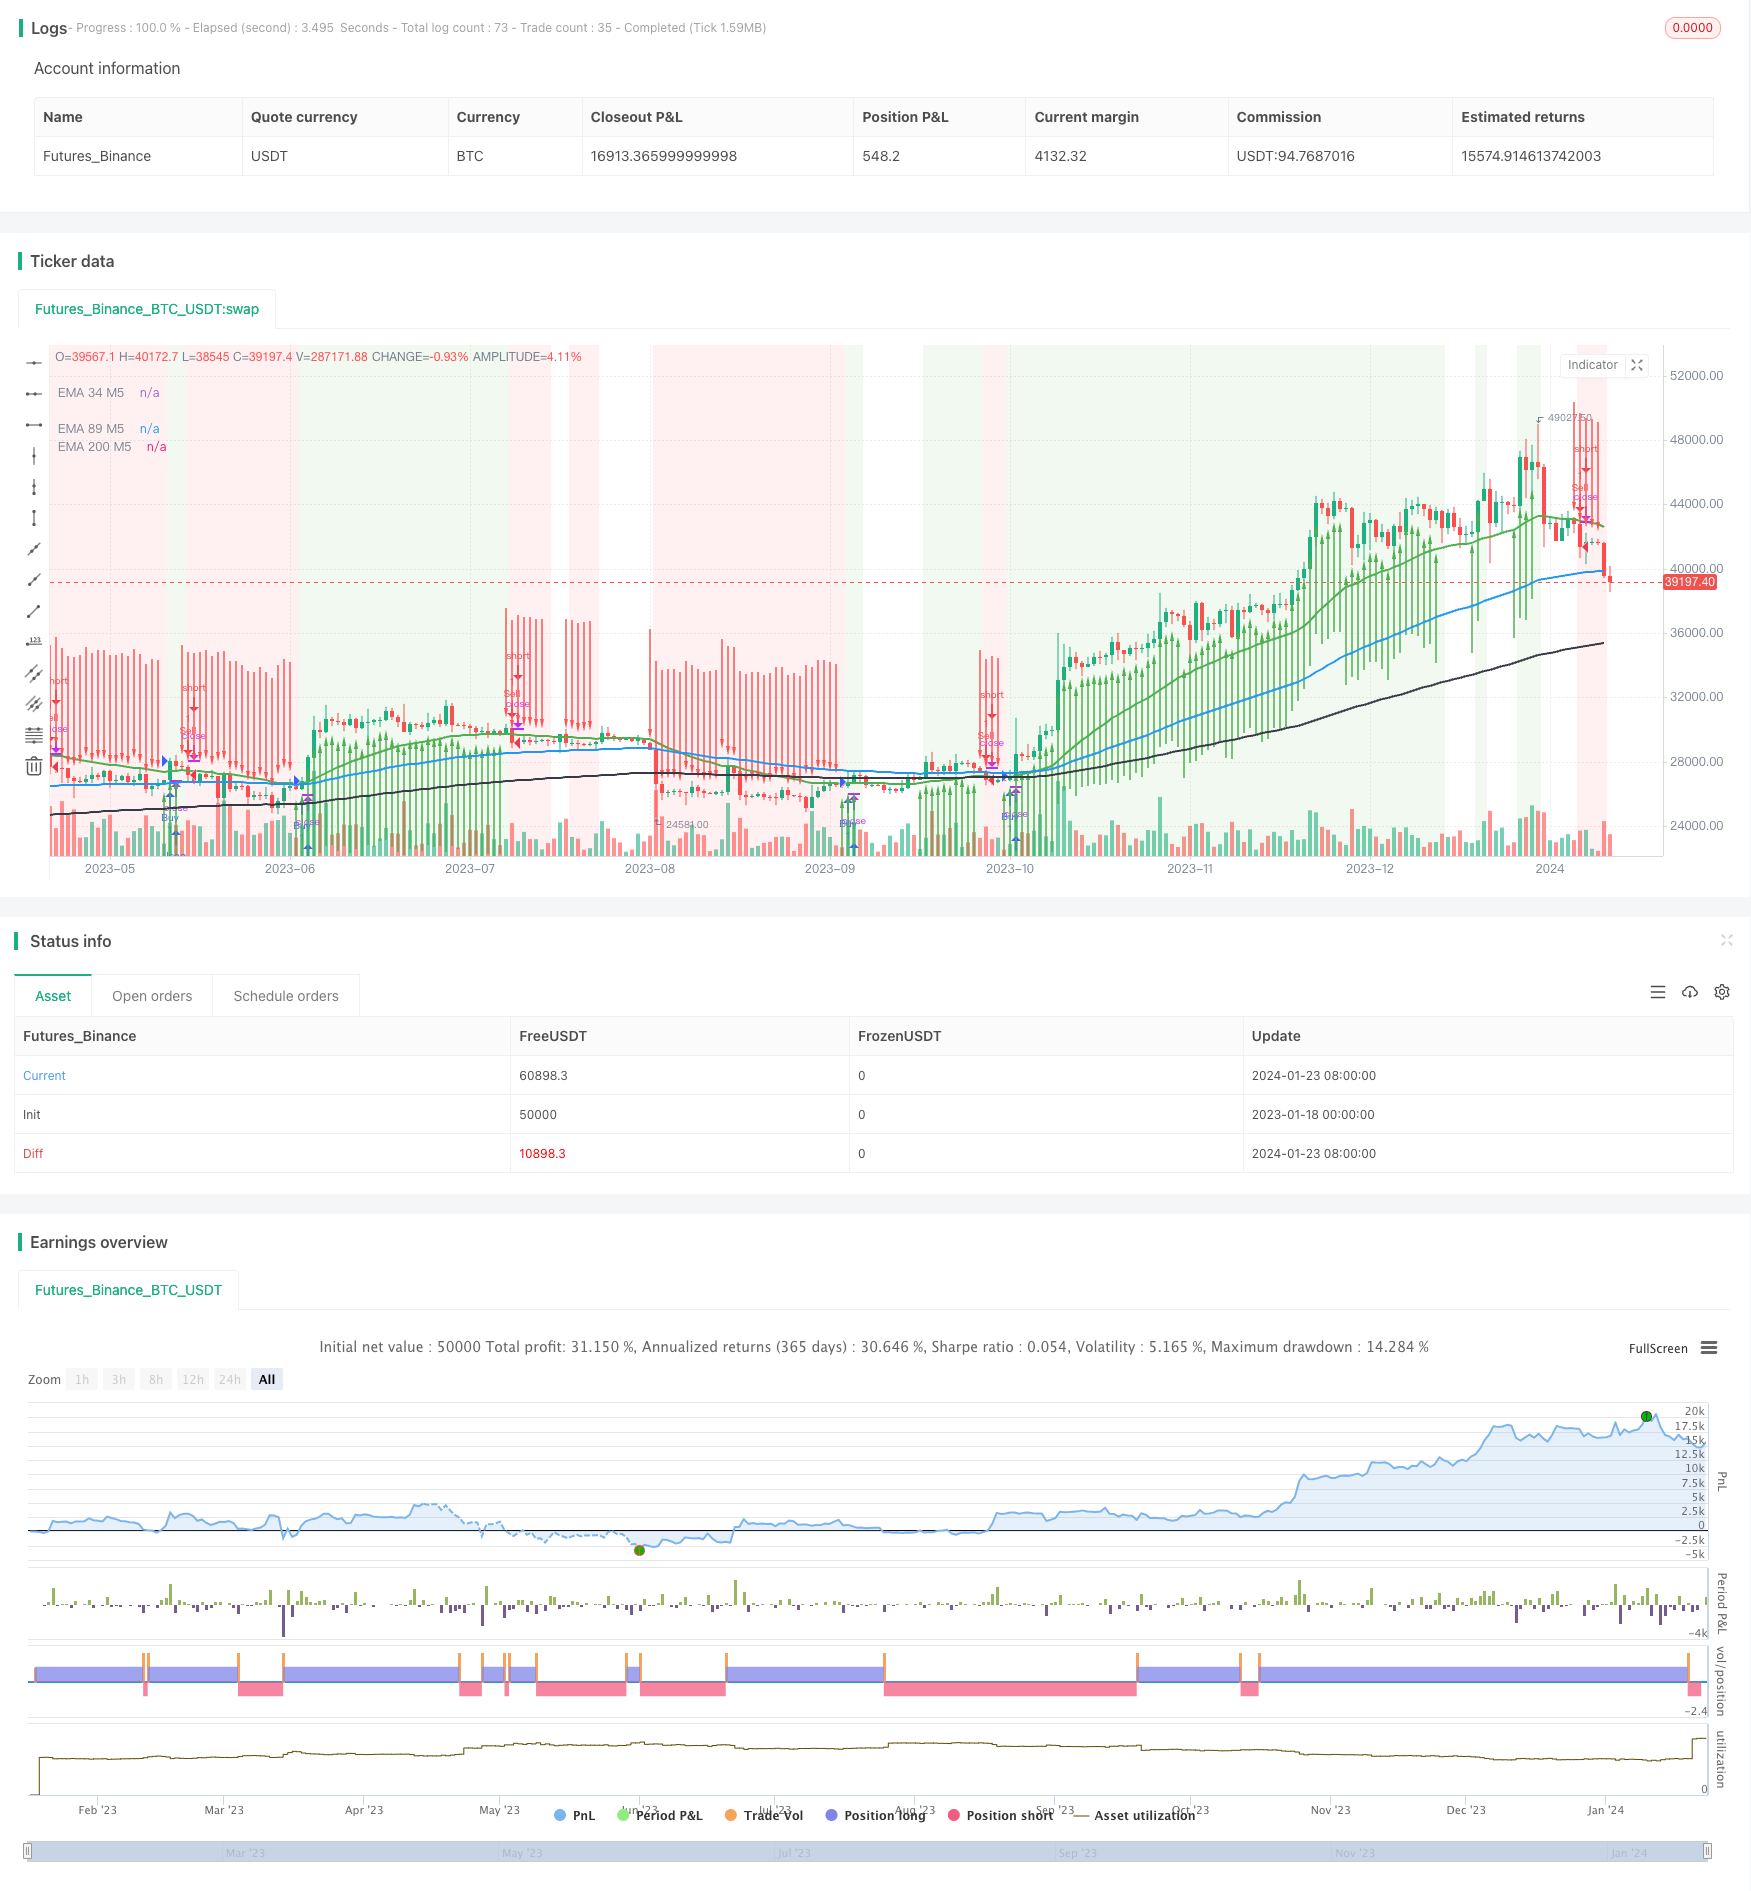
/*backtest
start: 2023-01-18 00:00:00
end: 2024-01-24 00:00:00
period: 1d
basePeriod: 1h
exchanges: [{"eid":"Futures_Binance","currency":"BTC_USDT"}]
*/

//@version=5
strategy("2 EMA di+ Buy Sell, strategy ", overlay=true)

// Define the EMA calculation function
ema(src, length) =>
    ta.ema(src, length)

// Calculate and plot EMA on M5
ema34_M5 = ema(close, 34)
ema89_M5 = ema(close, 89)
ema200_M5 = ema(close, 200)

// Plot EMAs
plot(ema34_M5, color=color.green, title="EMA 34 M5", linewidth=2)
plot(ema89_M5, color=color.blue, title="EMA 89 M5", linewidth=2)
plot(ema200_M5, color=color.black, title="EMA 200 M5", linewidth=2)

// Define DMI parameters
len = input(14, title="DI Length")
up = ta.change(high)
down = -ta.change(low)
plusDM = na(up) ? na : (up > down and up > 0 ? up : 0)
minusDM = na(down) ? na : (down > up and down > 0 ? down : 0)
trur = ta.rma(ta.tr, len)
plusDI = 100 * ta.rma(plusDM, len) / trur
minusDI = 100 * ta.rma(minusDM, len) / trur

// Calculate ADX
adxValue = 100 * ta.rma(math.abs(plusDI - minusDI) / (plusDI + minusDI == 0 ? 1 : plusDI + minusDI), len)

// Define MACD parameters
fastLength = input(12, title="Fast Length")
slowLength = input(26, title="Slow Length")
signalLength = input(9, title="Signal Length")

// Calculate MACD
[macdLine, signalLine, _] = ta.macd(close, fastLength, slowLength, signalLength)

// Create buy/sell conditions
buyCondition = close > ema34_M5 and plusDI > 17 and adxValue > minusDI
sellCondition = close < ema34_M5 and minusDI > 17 and adxValue > plusDI

// Strategy logic
strategy.entry("Buy", strategy.long, when = buyCondition)
strategy.entry("Sell", strategy.short, when = sellCondition)

// Create alerts for buy/sell signals
alertcondition(buyCondition, title="Buy Signal", message="Buy Signal")
alertcondition(sellCondition, title="Sell Signal", message="Sell Signal")

// Plot buy/sell arrows on the price chart
bgcolor(buyCondition ? color.new(color.green, 90) : sellCondition ? color.new(color.red, 90) : na)

plotarrow(buyCondition ? 1 : sellCondition ? -1 : na, colorup=color.new(color.green, 0), colordown=color.new(color.red, 0), offset=-1)