개요
이 글은 주로 상대적으로 강한 지표 ((RSI) 를 기반으로 설계된 주식 거래 쌍방향 피라미드 전략에 대해 소개한다. 이 전략은 RSI 지표를 통해 주식의 과매매 영역을 판단하고, 피라미드 가축 원칙에 부합하여 수익을 창출한다.
전략 원칙
- RSI 지표를 사용하여 주식이 초과 판매 영역에 진입했는지 판단하십시오. RSI가 25보다 낮으면 초과 판매, 80보다 높으면 초과 구매입니다.
- RSI가 초매권에 들어갔을 때, 상장하기 시작합니다. RSI가 초매권에 들어갔을 때는 상장하기 시작합니다.
- 피라미드 방식으로 최대 7번의 입금한다. 매번 입금한 후에 스톱스피드 포인트를 설정한다.
우위 분석
- RSI를 사용하여 과매매 영역을 판단하여 큰 가격 반전의 기회를 잡을 수 있습니다.
- 피라미드 투자 방식은 시장이 제대로 작동할 때 우수한 수익률을 얻을 수 있다.
- 매번 매장한 후에 Stop Loss을 설정하면 위험을 조절할 수 있다.
위험 분석
- RSI 지표는 과매매의 효과를 판단하는 데 있어 불안정하며, 잘못된 신호가 나타날 수 있다.
- 이 경우, 이자율을 정하는 것이 필요합니다. 이자율이 너무 높으면 위험성이 증가합니다.
- 정지 손실 지점 설정은 변동률을 고려해야 하며 너무 작게 설정할 수 없습니다.
최적화 방향
- 다른 지표와 결합하여 RSI 신호를 필터링하는 것이 고려될 수 있습니다. KDJ, BOLL 등과 같은 지표의 조합.
- 가격 추적을 위해 부동 손실을 설정할 수 있습니다. 변동성과 위험 관리 요구에 따라 동적으로 조정합니다.
- 시장상황에 따라 (부어시장, 곰시장 등) 자율적 변수를 사용하는 것을 고려할 수 있다.
요약하다
이 전략은 RSI 지표와 피라미드 가장 전략을 결합하여 과매매 과매매를 판단하는 동시에 가장으로 더 많은 수익을 얻을 수 있습니다. RSI 판단 정확도가 향상될 수 있지만, 합리적인 매개 변수를 최적화하면 다른 지표와 결합하여 효과 안정적인 거래 전략을 형성 할 수 있습니다. 이 전략은 어느 정도 적용 가능하며, 비교적 간단한 직접적인 수량 거래 방법입니다.
전략 소스 코드
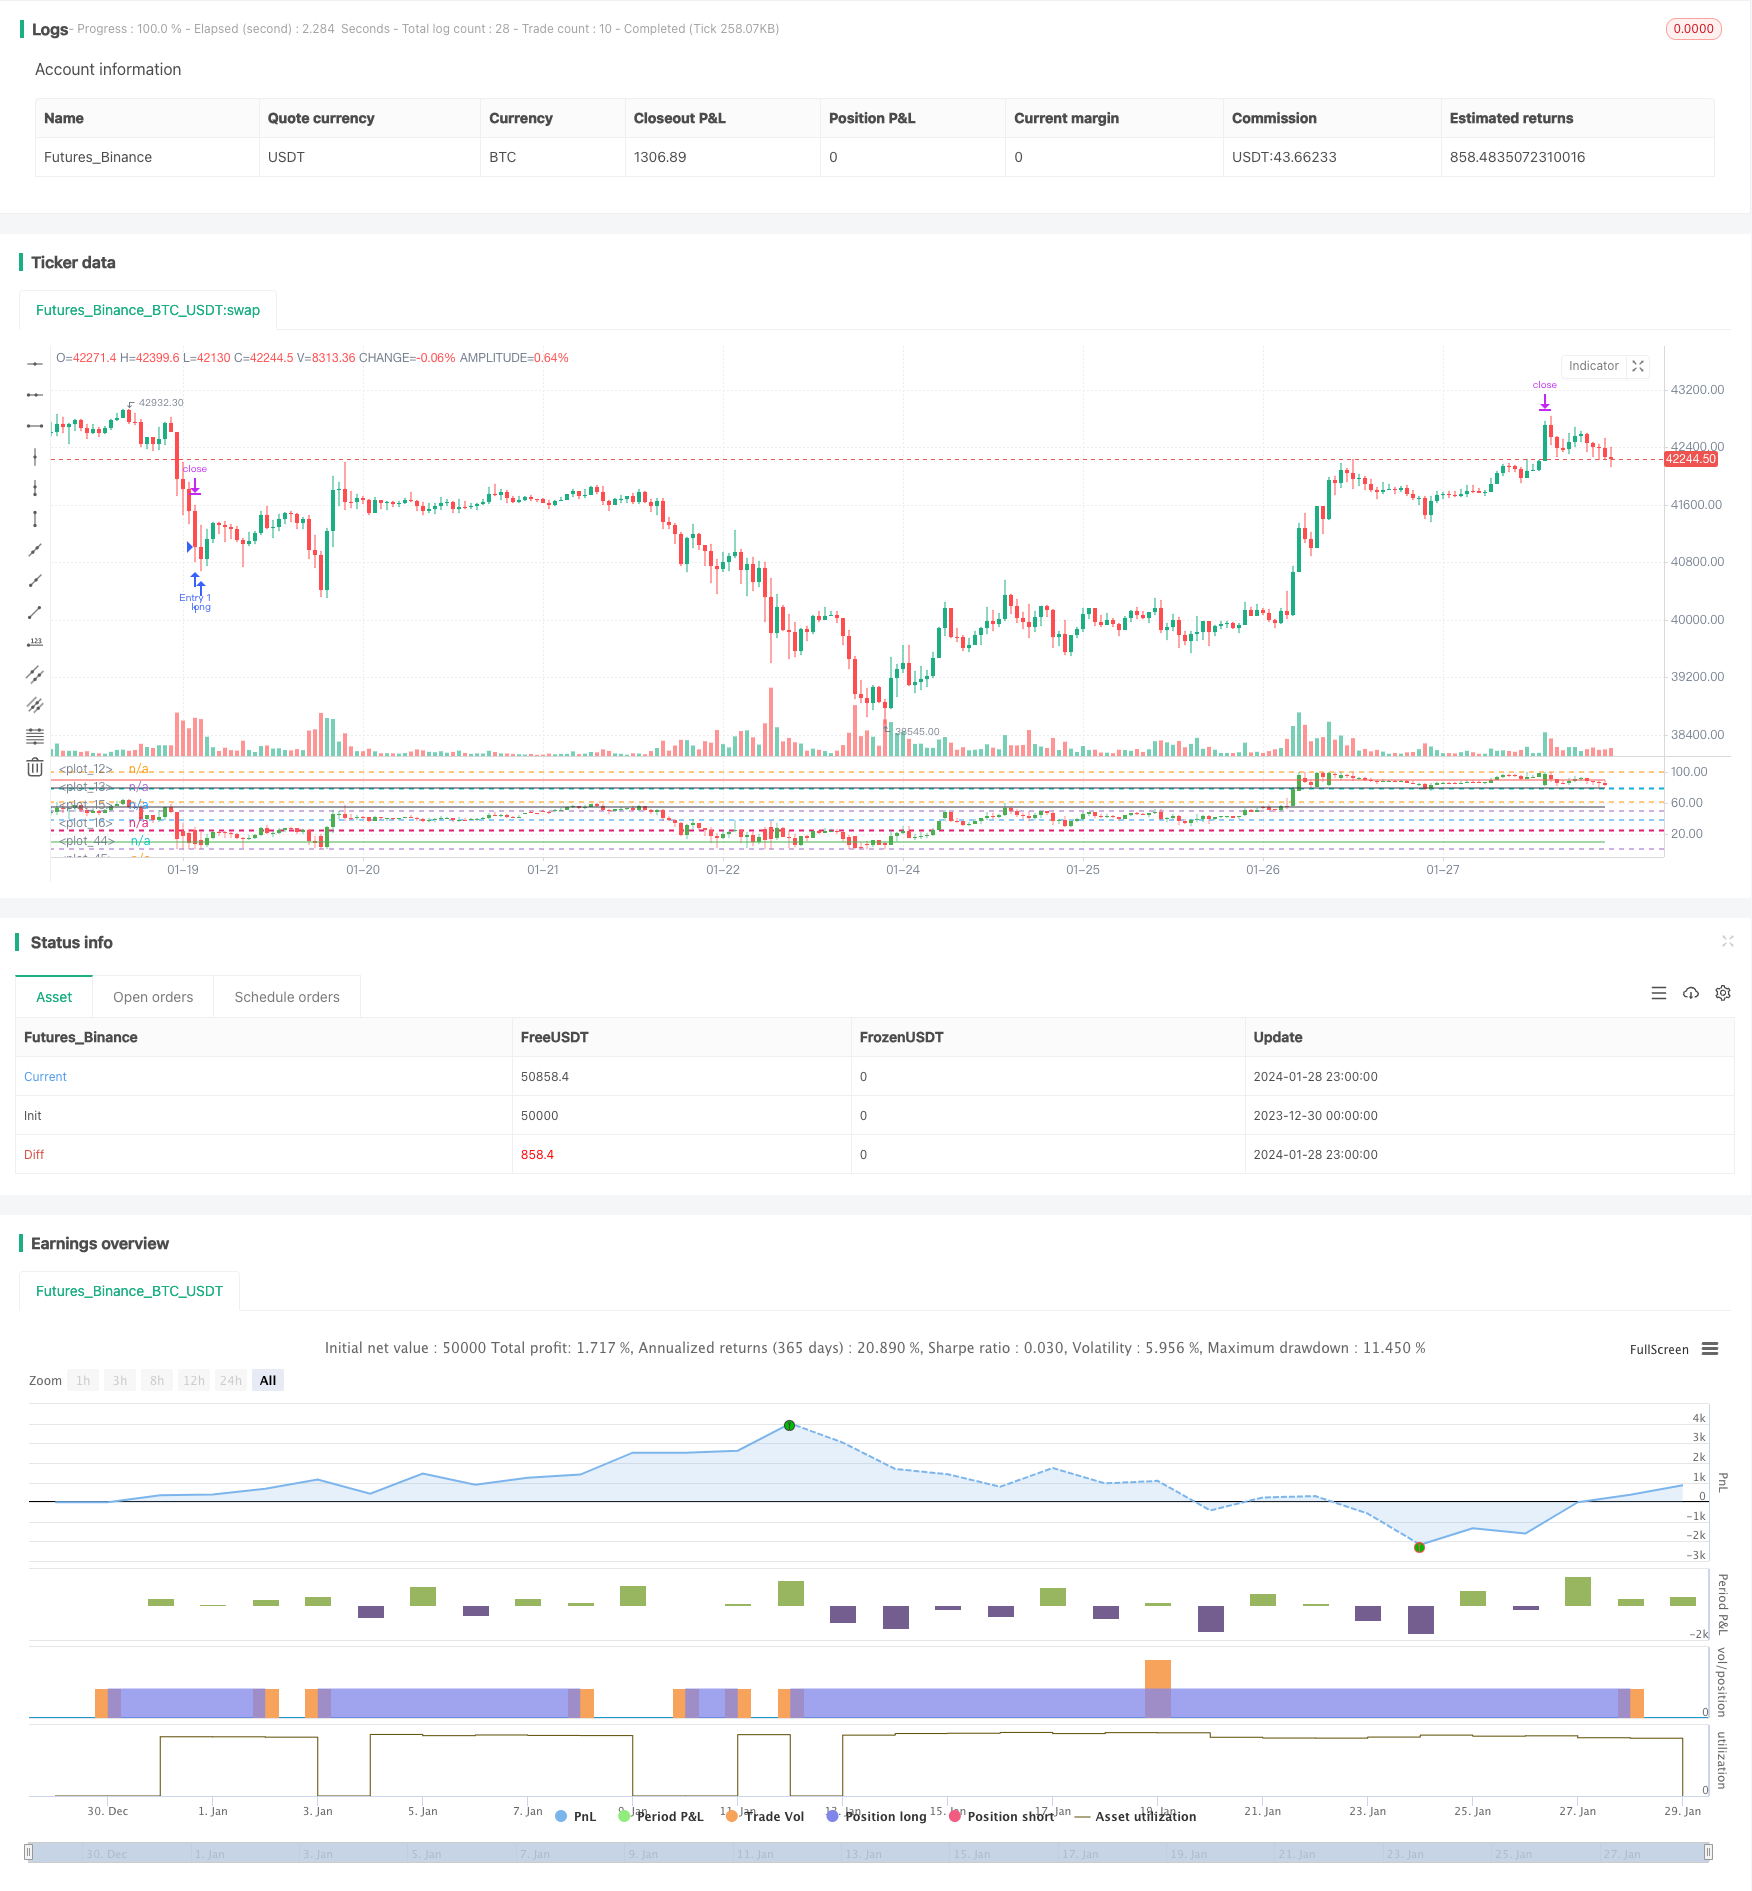
/*backtest
start: 2023-12-30 00:00:00
end: 2024-01-29 00:00:00
period: 1h
basePeriod: 15m
exchanges: [{"eid":"Futures_Binance","currency":"BTC_USDT"}]
*/

//@version=4
// This source code is subject to the terms of the Mozilla Public License 2.0 at https://mozilla.org/MPL/2.0/
// © RafaelZioni

strategy(title='Simple RSI strategy', overlay=false)

SWperiod = 1
look = 0
OverBought = input(80, minval=50)
OverSold = input(25, maxval=50)

bandmx = hline(100)
bandmn = hline(0)

band1 = hline(OverBought)
band0 = hline(OverSold)
//band50 = hline(50, color=black, linewidth=1)
fill(band1, band0, color=color.purple, transp=98)


src = close
len = input(5, minval=1, title="RSI Length")
up = rma(max(change(src), 0), len)
down = rma(-min(change(src), 0), len)
rsi = down == 0 ? 100 : up == 0 ? 0 : 100 - 100 / (1 + up / down)

p = 100

//scale
hh = highest(high, p)
ll = lowest(low, p)
scale = hh - ll

//dynamic OHLC
dyno = (open - ll) / scale * 100
dynl = (low - ll) / scale * 100
dynh = (high - ll) / scale * 100
dync = (close - ll) / scale * 100

//candle color
color_1 = close > open ? 1 : 0

//drawcandle
hline(78.6)
hline(61.8)
hline(50)
hline(38.2)
hline(23.6)
plotcandle(dyno, dynh, dynl, dync, title="Candle", color=color_1 == 1 ? color.green : color.red)
plot(10, color=color.green)
plot(55, color=color.black)
plot(80, color=color.black)
plot(90, color=color.red)

long = rsi <= OverSold ? 5 : na

//Strategy
golong = rsi <= OverSold ? 5 : na

longsignal = golong
//based on https://www.tradingview.com/script/7NNJ0sXB-Pyramiding-Entries-On-Early-Trends-by-Coinrule/
//set take profit

ProfitTarget_Percent = input(3)
Profit_Ticks = close * (ProfitTarget_Percent / 100) / syminfo.mintick

//set take profit

LossTarget_Percent = input(10)
Loss_Ticks = close * (LossTarget_Percent / 100) / syminfo.mintick


//Order Placing

strategy.entry("Entry 1", strategy.long, when=strategy.opentrades == 0 and longsignal)

strategy.entry("Entry 2", strategy.long, when=strategy.opentrades == 1 and longsignal)

strategy.entry("Entry 3", strategy.long, when=strategy.opentrades == 2 and longsignal)

strategy.entry("Entry 4", strategy.long, when=strategy.opentrades == 3 and longsignal)

strategy.entry("Entry 5", strategy.long, when=strategy.opentrades == 4 and longsignal)

strategy.entry("Entry 6", strategy.long, when=strategy.opentrades == 5 and longsignal)

strategy.entry("Entry 7", strategy.long, when=strategy.opentrades == 6 and longsignal)


if strategy.position_size > 0
    strategy.exit(id="Exit 1", from_entry="Entry 1", profit=Profit_Ticks, loss=Loss_Ticks)
    strategy.exit(id="Exit 2", from_entry="Entry 2", profit=Profit_Ticks, loss=Loss_Ticks)
    strategy.exit(id="Exit 3", from_entry="Entry 3", profit=Profit_Ticks, loss=Loss_Ticks)
    strategy.exit(id="Exit 4", from_entry="Entry 4", profit=Profit_Ticks, loss=Loss_Ticks)
    strategy.exit(id="Exit 5", from_entry="Entry 5", profit=Profit_Ticks, loss=Loss_Ticks)
    strategy.exit(id="Exit 6", from_entry="Entry 6", profit=Profit_Ticks, loss=Loss_Ticks)
    strategy.exit(id="Exit 7", from_entry="Entry 7", profit=Profit_Ticks, loss=Loss_Ticks)