개요
삼계평균선 스톱스트로프 전략은 3개의 다른 주기의 지수 이동 평균에 기초하여 상장/시장 출시를 하는 트렌드 추적 전략이다. 그것은 동시에 평균 실물 파도 지표를 사용하여 스톱스트로프를 설정하고, 위험을 관리한다.
전략 원칙
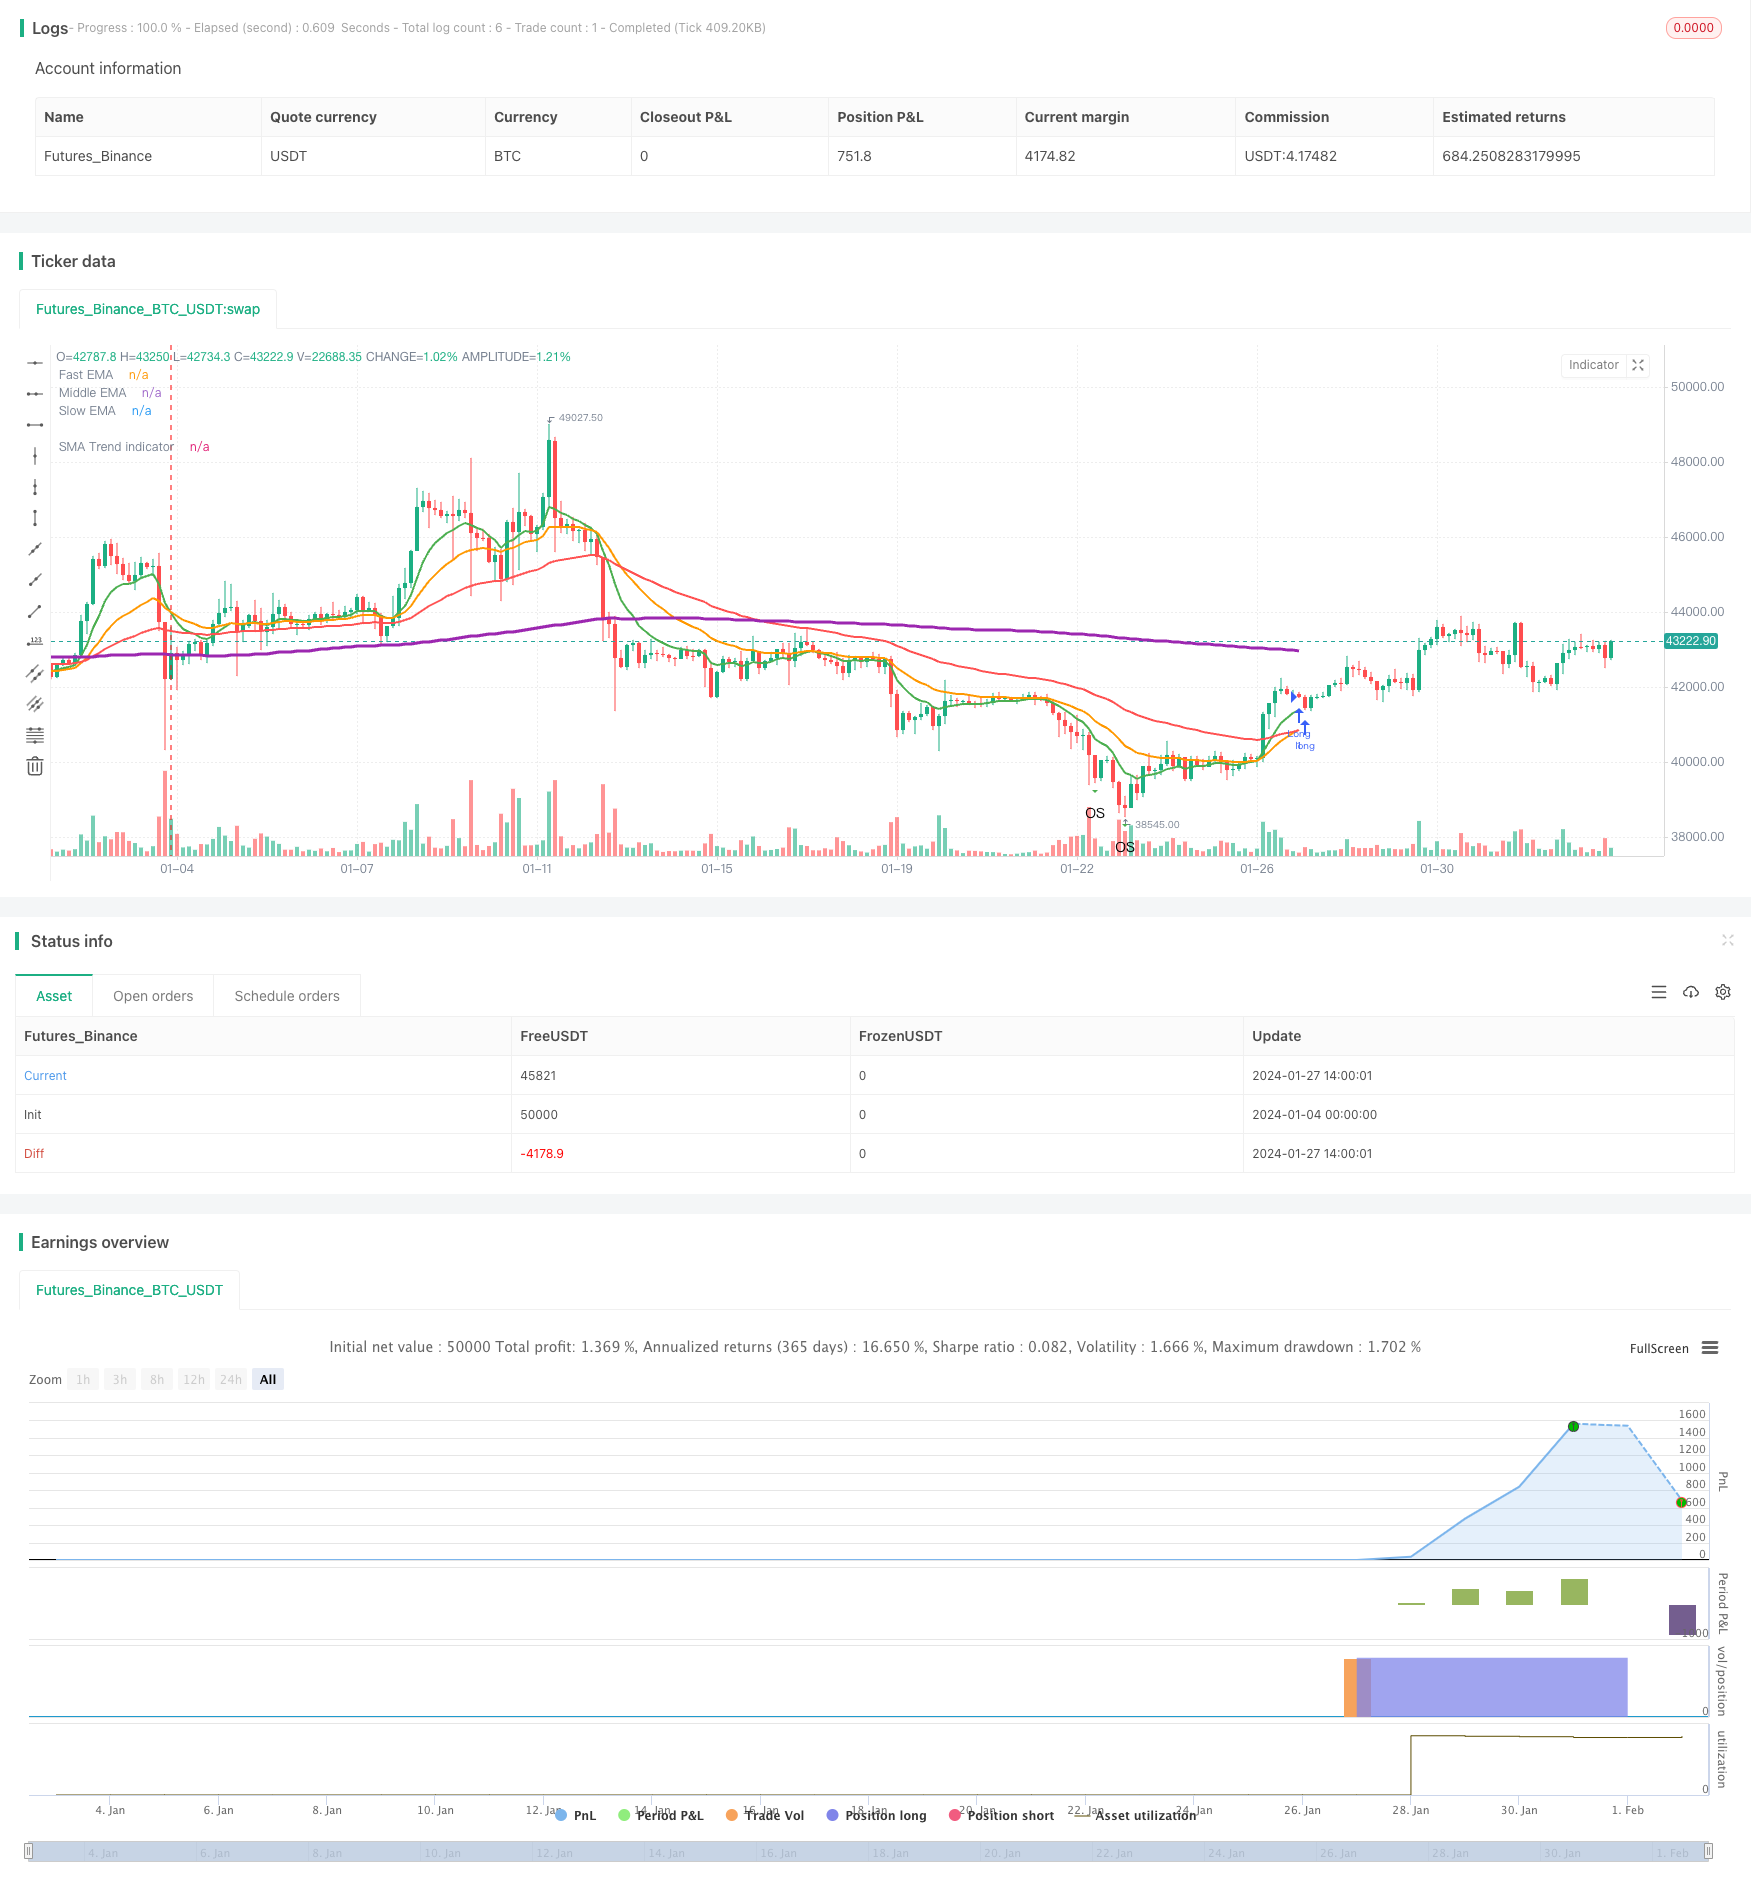
이 전략은 세 개의 지수 이동 평균을 사용합니다: 빠른 라인, 중간 라인, 느린 라인. 중간 라인에서 느린 라인을 통과 할 때 더 많이; 빠른 라인 아래에서 중간 라인을 통과 할 때 평평합니다. 이것은 전형적인 트렌드 추적 전략이며, 세 개의 평행 선의 다공간 변환을 통해 트렌드 방향을 판단합니다.
이 전략은 또한 평균 실제 파동의 지표를 사용하여 스톱 스톱 손실을 계산합니다. 구체적으로, 여러 단 하나의 스톱 스톱은 출입 가격 + 평균 실제 파동입니다.*정지 계수; 진입 가격으로 빈 정지 - 평균 실제 파도*스톱 코이센터. 스톱 손실 원칙은 스톱과 비슷하다. 이것은 일방적인 위험을 효과적으로 제한할 수 있다.
우위 분석
- 의사결정 지표는 직관적으로 명확하고 이해하기 쉽게 구현됩니다.
- 체계적이고, 쉽게 측정할 수 있습니다.
- 트렌드 추적과 리스크 관리를 동시에 고려한다.
위험 분석
- “이번 회전에는 지연이 있었고, 전환을 잡을 수 없었습니다”.
- 은 추세에서 손상을 입을 수 있다.
- 매개 변수 설정은 최적화해야 합니다. 그렇지 않으면 성능이 좋지 않습니다.
위험 대응 대책은: 적당히 평균 회기를 줄이고, 스톱 스톱 손실 계수를 최적화하고, 다른 의사 결정 지표 보조 판단을 추가한다.
최적화 방향
- 다양한 평균선 지표 조합으로 최적의 변수를 찾아보세요.
- MACD, RSI 등과 같은 다른 기술 지표 판단을 추가하십시오.
- 기계 학습 알고리즘을 사용하여 자동 최적화 파라미터.
- 실제 파도변동에 따라 정지 손실을 조정합니다.
- 감정 지표와 함께 거래가 너무 붐비는 것을 피하십시오.
요약하다
이 전략은 전반적으로 효과 안정적인 트렌드 추적 전략으로, 간단한 매개 변수 설정, 쉽게 구현할 수 있다. 평균 실제 파장의 동적 스톱 스톱 로즈를 통해 일방적인 위험을 제한할 수 있다. 그러나 매개 변수 최적화 및 지표 조합에 주의를 기울여야 하며, 과도한 최적화 및 의사 결정 지연을 방지한다. 전반적으로 위험-수익 균형이 좋으며, 고려할 가치가 있다.
전략 소스 코드
/*backtest
start: 2024-01-04 00:00:00
end: 2024-02-03 00:00:00
period: 3h
basePeriod: 15m
exchanges: [{"eid":"Futures_Binance","currency":"BTC_USDT"}]
*/

//@version=4
//© Densz
strategy("3EMA with TP & SL (ATR)", overlay=true )

// INPUTS
startTime           =       input(title="Start Time", type = input.time, defval = timestamp("01 Jan 2017 00:00 +0000"))
endTime             =       input(title="End Time", type = input.time, defval = timestamp("01 Jan 2022 00:00 +0000"))

slowEMALength       =       input(title="Slow EMA Length", type = input.integer, defval = 55)
middleEMALength     =       input(title="Middle EMA Length", type = input.integer, defval = 21)
fastEMALength       =       input(title="Fast EMA Length", type = input.integer, defval = 9)

trendMALength       =       input(title="Trend indicator MA Length", type = input.integer, defval = 200)

atrLength           =       input(title="ATR Length", type = input.integer, defval = 14)
tpATRMult           =       input(title="Take profit ATR multiplier", type = input.integer, defval = 3)
slATRMult           =       input(title="Stop loss ATR multiplier", type = input.integer, defval = 2)

rsiLength           =       input(title="RSI Length", type = input.integer, defval = 14)

// Indicators
slowEMA             =       ema(close, slowEMALength)
middEMA             =       ema(close, middleEMALength)
fastEMA             =       ema(close, fastEMALength)
atr                 =       atr(atrLength)

rsiValue            =       rsi(close, rsiLength)
isRsiOB             =       rsiValue >= 80
isRsiOS             =       rsiValue <= 20

sma200              =       sma(close, trendMALength)

inDateRange         =       true

// Plotting
plot(slowEMA, title="Slow EMA", color=color.red, linewidth=2, transp=50)
plot(middEMA, title="Middle EMA", color=color.orange, linewidth=2, transp=50)
plot(fastEMA, title="Fast EMA", color=color.green, linewidth=2, transp=50)

plot(sma200, title="SMA Trend indicator", color=color.purple, linewidth=3, transp=10)
plotshape(isRsiOB, title="Overbought", location=location.abovebar, color=color.red, transp=0, style=shape.triangledown, text="OB")
plotshape(isRsiOS, title="Oversold", location=location.belowbar, color=color.green, transp=0, style=shape.triangledown, text="OS")

float takeprofit    =       na
float stoploss      =       na

var line tpline     =       na
var line slline     =       na

if strategy.position_size != 0
    takeprofit := takeprofit[1]
    stoploss := stoploss[1]
    line.set_x2(tpline, bar_index)
    line.set_x2(slline, bar_index)
    line.set_extend(tpline, extend.none)
    line.set_extend(slline, extend.none)

// STRATEGY
goLong  = crossover(middEMA, slowEMA) and inDateRange
closeLong = crossunder(fastEMA, middEMA) and inDateRange


if goLong
    takeprofit := close + atr * tpATRMult
    stoploss := close - atr * slATRMult
    // tpline := line.new(bar_index, takeprofit, bar_index, takeprofit, color=color.green, width=2, extend=extend.right, style=line.style_dotted)
    // slline := line.new(bar_index, stoploss, bar_index, stoploss, color=color.red, width=2, extend=extend.right, style=line.style_dotted)
    // label.new(bar_index, takeprofit, "TP", style=label.style_labeldown)
    // label.new(bar_index, stoploss, "SL", style=label.style_labelup)
    strategy.entry("Long", strategy.long, when = goLong)
    strategy.exit("TP/SL", "Long", stop=stoploss, limit=takeprofit)
if closeLong
    takeprofit := na
    stoploss := na
    strategy.close(id = "Long", when = closeLong)

if (not inDateRange)
    strategy.close_all()