개요
이 전략은 여러 가지 기술 지표를 결합하여, RSI, ADX 및 ATR 지표와 결합하여, 볼반 반지표가 가격 반전 신호를 발산할 때 시장 구조를 판단하여, 높은 확률의 반전 거래 기회를 찾습니다.
전략 원칙
20주기의 볼밴드를 사용하여, 가격이 상하로 도달할 때 반전 K선으로 구성된 매매 신호를 기다린다.
RSI 지표는 시장이 흔들림 영역에 있는지 판단합니다. RSI는 60보다 높으면 낙점 영역이며, 40보다 낮으면 낙점 영역입니다.
ADX는 20보다 낮으면 시장이 흔들리고, 20보다 높으면 시장의 추세 상태를 판단한다.
ATR 중지 손실 설정 및 추적 중지.
EMA 일선 필터링 신호와 결합.
전략적 강점 분석
여러 지표가 합쳐져 높은 확률의 거래 신호를 형성한다.
다른 시장 환경에 적응할 수 있는 파라미터를 구성할 수 있다.
은 규칙, 효과적인 위험 관리.
전략적 위험 분석
잘못된 매개 변수 설정으로 인해 거래가 너무 빈번하게 이루어질 수 있습니다.
하지만, 이 모든 것은 여전히 실패할 가능성이 있습니다.
특정 시장에서는 스톱로스 추적이 작동하지 않을 수 있습니다.
전략 최적화 방향
더 많은 지표의 조합을 테스트하여 더 적합한 변수 구성을 찾습니다.
실패한 돌파구를 뒤집을 수 있는 기회를 제때 발견하라.
다른 손해 방지 방법을 테스트하여 더 지능적인 손해 방지 방법을 사용하십시오.
요약하다
이 전략은 보르반 밴드를 기본 거래 신호로 사용하면서 여러 보조 지표가 높은 확률 필터링 시스템을 형성하고, 스톱 로즈 규칙도 비교적 완벽하다. 매개 변수 조정과 지표 최적화를 통해 전략의 성능을 더욱 향상시킬 수 있다. 전체적으로 볼 때, 이 전략은 신뢰할 수 있는 역전 거래 시스템을 형성한다.
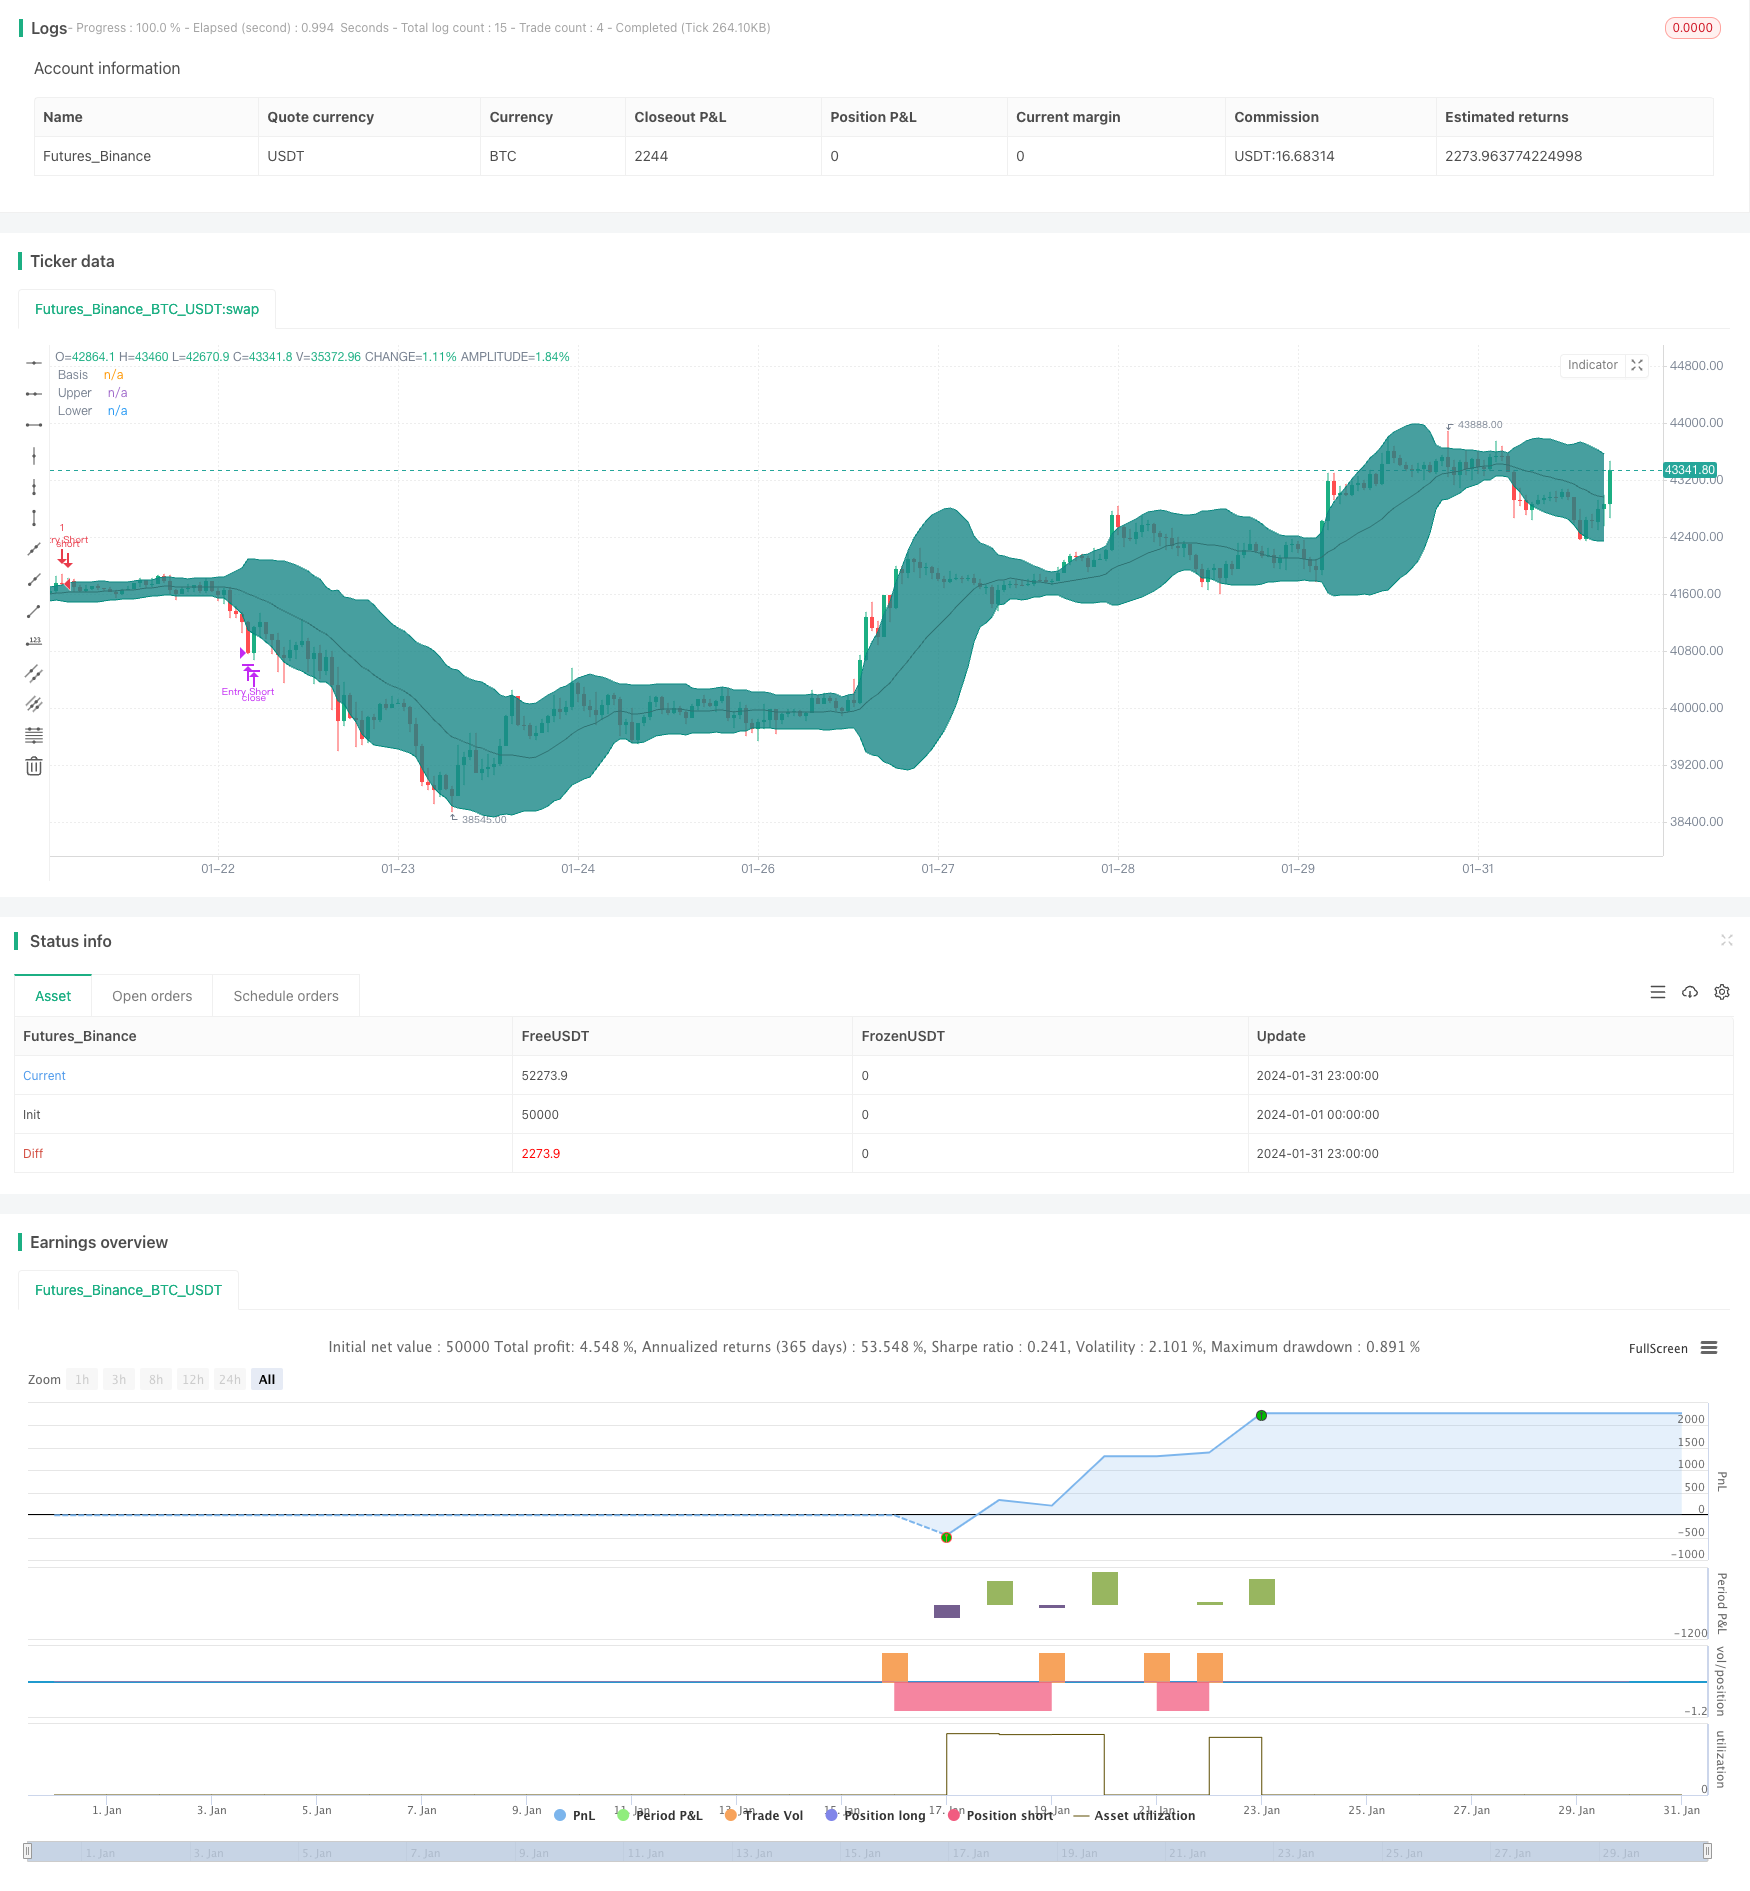
/*backtest
start: 2024-01-01 00:00:00
end: 2024-01-31 23:59:59
period: 1h
basePeriod: 15m
exchanges: [{"eid":"Futures_Binance","currency":"BTC_USDT"}]
*/

//@version=4
strategy(shorttitle="BB + EMA + RSI + ADX + ATR Reversal", title="Bollinger Bands Reversal", overlay=true)

// Inputs
ema1Input       = input(title = "EMA1 Input",                          defval = 200,   minval = 10,    maxval = 400,   step = 10,                      group = "Indicators")
ema2Input       = input(title = "EMA2 Input",                          defval = 100,   minval = 10,    maxval = 400,   step = 10,                      group = "Indicators")
length          = input(title = "BB Length",                           defval = 20,    minval=1,                                                       group = "Bollinger Band Indicator")
bbsrc           = input(title = "BB Source",                            defval = close,                                                                 group = "Bollinger Band Indicator")
mult            = input(title = "BB Standard Deviation",            type = input.float,     defval = 2.0,   minval=0.001,   maxval=50,                                      group = "Bollinger Band Indicator")
offset          = input(title = "BB Offset",                           defval = 0,     minval = -500,  maxval = 500,                                   group = "Bollinger Band Indicator")
rsilen          = input(title = "RSI Length",                          defval = 14,    minval=1,                                                       group = "RSI Indicator")
rsisrc          = input(title = "RSI Source",                           defval = close,                                                                 group = "RSI Indicator")
rsiMaxEntry     = input(title = "RSI Maximum Value",                   defval = 60,    minval = 50,    maxval = 100,                                   group = "RSI Indicator")
rsiMinEntry     = input(title = "RSI Minimum Value",                   defval = 40,    minval = 0,     maxval = 50,                                    group = "RSI Indicator")
rsiMaxExit      = input(title = "RSI Max Exit Value",                  defval = 70,    minval = 50,    maxval = 100,                                   group = "RSI Indicator")
rsiMinExit      = input(title = "RSI Min Exit Value",                  defval = 30,    minval = 0,     maxval = 50,                                    group = "RSI Indicator")
atrLength       = input(title = "ATR Length",                          defval = 14,    minval = 1,                                                     group = "ATR Indicator")
useStructure    = input(title = "Use Trailing Stop?",               type = input.bool,      defval = true,                                                                  group = "ATR Indicator")
atrlookback     = input(title = "ATR Lookback Period",                 defval = 7,     minval = 1,                                                     group = "ATR Indicator")
atrMultiplier   = input(title = "ATR Multiplier",                   type = input.float,     defval = 1.0,   minval = 0.1,                                                   group = "ATR Indicator")
sigMaxValue     = input(title = "ADX Max Value",                    type = input.float,     defval = 20.0,  minval = 0,     maxval = 100,   step = 0.1,                     group = "ADX Indicator")
adxlen          = input(title = "ADX Smoothing",                       defval = 14,                                                                    group = "ADX Indicator")
dilen           = input(title = "DI Length",                           defval = 14,                                                                    group = "ADX Indicator")

// Date input
fromMonth       = input(defval = 1,    title = "From Month",           minval = 1,     maxval = 12,    group = "Backtest Date Range")
fromDay         = input(defval = 1,    title = "From Day",             minval = 1,     maxval = 31,    group = "Backtest Date Range")
fromYear        = input(defval = 2000, title = "From Year",            minval = 1970,                  group = "Backtest Date Range")
thruMonth       = input(defval = 1,    title = "Thru Month",           minval = 1,     maxval = 12,    group = "Backtest Date Range")
thruDay         = input(defval = 1,    title = "Thru Day",             minval = 1,     maxval = 31,    group = "Backtest Date Range")
thruYear        = input(defval = 2099, title = "Thru Year",            minval = 1970,                  group = "Backtest Date Range")
inDataRange     = true

// Built in Bollinger Band
basis           = sma(bbsrc, length)
dev             = mult * stdev(bbsrc, length)
upper           = basis + dev
lower           = basis - dev
// Built in RSI
up              = rma(max(change(rsisrc), 0), rsilen)
down            = rma(-min(change(rsisrc), 0), rsilen)
rsi             = down == 0 ? 100 : up == 0 ? 0 : 100 - (100 / (1 + up / down))
// Built in ADX
dirmov(len) =>
	up = change(high)
	down = -change(low)
	plusDM = na(up) ? na : (up > down and up > 0 ? up : 0)
	minusDM = na(down) ? na : (down > up and down > 0 ? down : 0)
	truerange = rma(tr, len)
	plus = fixnan(100 * rma(plusDM, len) / truerange)
	minus = fixnan(100 * rma(minusDM, len) / truerange)
	[plus, minus]
adx(dilen, adxlen) =>
	[plus, minus] = dirmov(dilen)
	sum = plus + minus
	adx = 100 * rma(abs(plus - minus) / (sum == 0 ? 1 : sum), adxlen)
sig = adx(dilen, adxlen)

// Custom variables
ema1 = ema(close, ema1Input)
ema2 = ema(close, ema2Input)
atr = atr(atrLength)

// Entry and exit signals
CrossLongEntry  = (close <= lower or close[1] <= lower[1]) and close > open and close[1] < open[1] and close > ema1 and close > ema2 and strategy.position_size == 0 and inDataRange and rsi > rsiMinEntry and rsi < rsiMaxEntry and sig < sigMaxValue
CrossShortEntry = (close >= upper or close[1] >= upper[1]) and close < open and close[1] > open[1] and close < ema1 and close < ema2 and strategy.position_size == 0 and inDataRange and rsi > rsiMinEntry and rsi < rsiMaxEntry and sig < sigMaxValue

CrossLongExit   = (close >= upper or close[1] >= upper[1]) and close < open and close[1] > open[1] and strategy.position_size > 0 and inDataRange or rsi < rsiMinExit or rsi > rsiMaxExit
CrossShortExit  = (close <= lower or close[1] <= lower[1]) and close > open and close[1] < open[1] and strategy.position_size < 0 and inDataRange or rsi < rsiMinExit or rsi > rsiMaxExit

// Determining the stop loss based on ATR
StopLossLong    = (useStructure ? lowest(low, atrlookback) : close) - atr * atrMultiplier
StopLossShort   = (useStructure ? highest(high, atrlookback) : close) + atr * atrMultiplier

// Custom variables used to store the stoploss value
var StopLong    = 0.0
var StopShort   = 0.0
// Telling my script to store the stoploss value in the corresponding variables
if CrossLongEntry
    StopLong := StopLossLong
if CrossShortEntry
    StopShort := StopLossShort

// Strategy
strategy.entry("Entry Long", strategy.long, when = CrossLongEntry, comment = "Entry Long")
strategy.close("Entry Long", when = CrossLongExit or close < StopLong, comment = "Long Exit")

strategy.entry("Entry Short", strategy.short, when = CrossShortEntry, comment = "Entry Short")
strategy.close("Entry Short", when = CrossShortExit or close > StopShort, comment = "Short Exit")

// Plots the Bollinger Band
plot(basis, "Basis", color=#872323, offset = offset)
p1 = plot(upper, "Upper", color=color.teal, offset = offset)
p2 = plot(lower, "Lower", color=color.teal, offset = offset)
fill(p1, p2, title = "Background", color=#198787, transp=95)

// Use this if you want to see the stoploss visualised, be aware though plotting these can be confusing
// plot(StopLong)
// plot(StopShort)