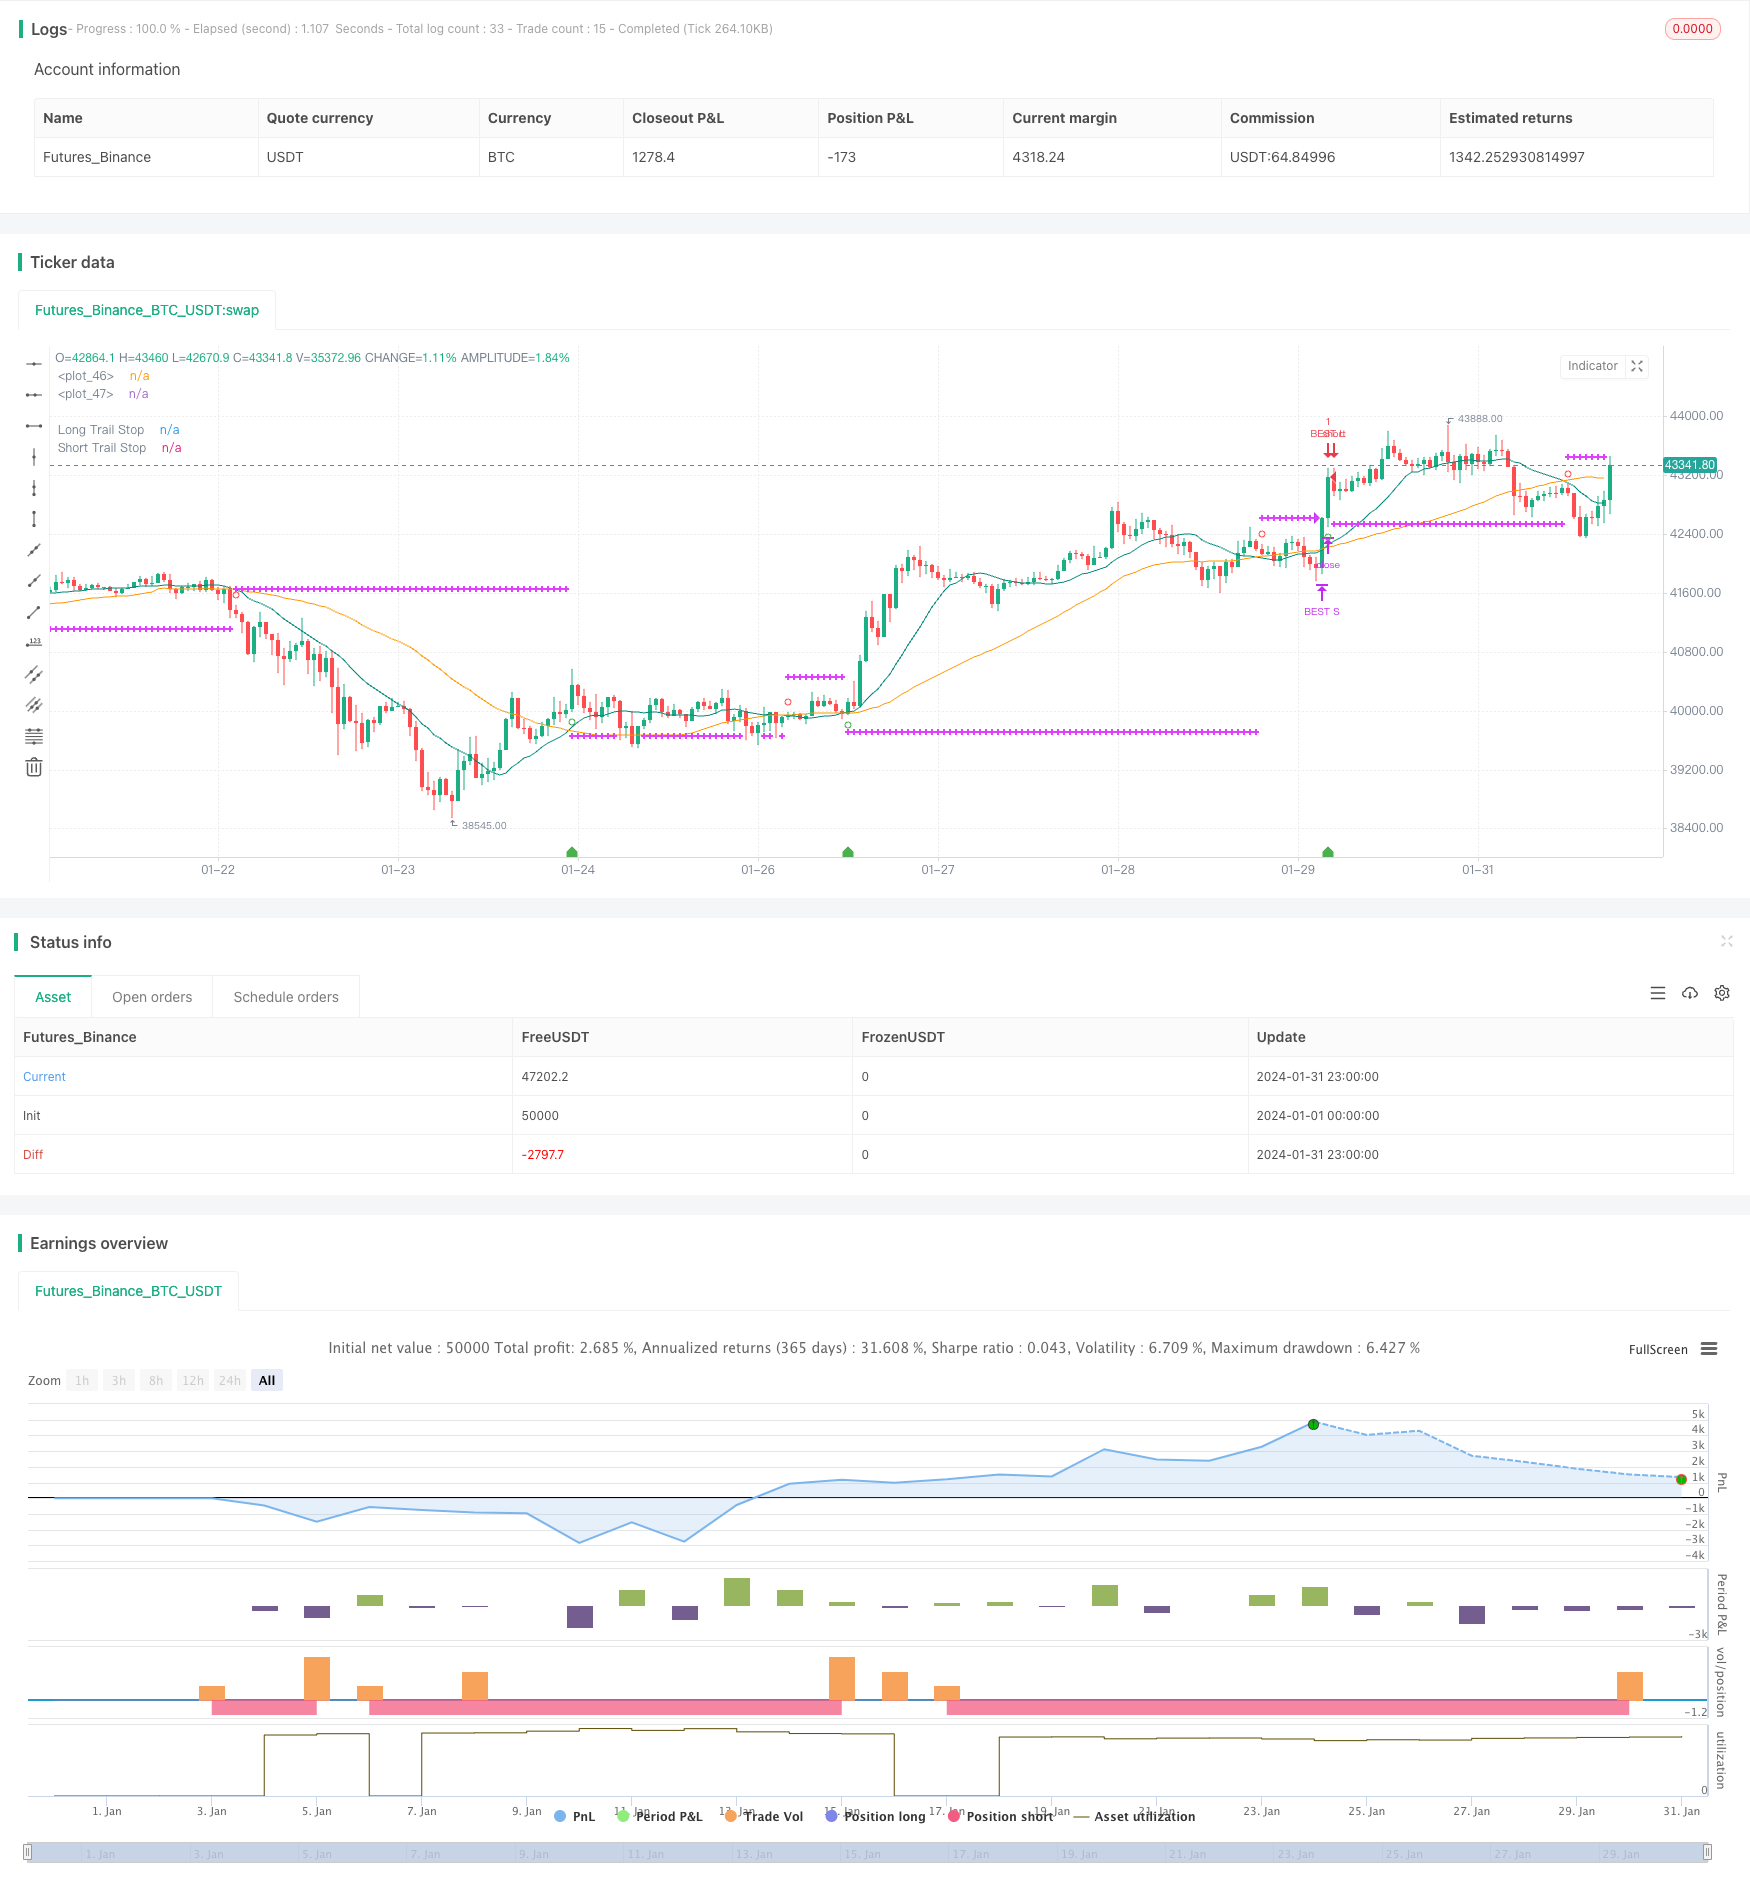
개요
최적의 ATR 정지 손실 배수 전략은 평균 실제 파장의 배수를 사용하여 정지점을 설정하고, 동적으로 위험을 조정하는 트렌드 추적 전략입니다. 가격 추세가 바뀌면, 막대한 손실을 피하기 위해 제 시간에 정지 할 수 있습니다.
전략 원칙
이 전략은 먼저 빠른 SMA 주기와 느린 SMA 주기의 간단한 이동 평균을 계산하고, 빠른 SMA 상에서 느린 SMA를 통과할 때 더 많이 하고, 빠른 SMA 아래에서 느린 SMA를 통과할 때 더 적어진다.
입시 후, 그것은 ATR의 수치를 실시간으로 모니터링한다. ATR은 과거 특정 주기 동안의 평균 변동량을 나타낸다. 이 정책은 ATR의 주기 길이를 설정할 수 있다. (선택된 14) 그리고 배수 (선택된 2). 시스템은 입시에서 ATR 값을 계산하고, 설정된 배수를 곱하여, 스톱 손실 거리로 한다.
예를 들어, 입점 후 ATR이 50점이고, 배수가 2로 설정되어 있다면, 스톱 로드 거리는 100점이다. 가격이 100점을 넘어서면 스톱 로드 명령이 트리거된다. 이것은 적시에 스톱 로드를 해, 과도한 손실을 방지한다.
이 전략은 동시 트렌드 판단을 고려하여, 구매 신호가 상승하는 추세와 일치할 때만 긴 포지션 스톱을 활성화한다. 상하 신호는 하락하는 추세와 일치할 때 활성화된다.
정지선은 차트에 그려져 있고, 우리는 실시간으로 검증할 수 있다. 정지 조건이 촉발될 때, 해당 포지션도 시스템에서 자동으로 평정된다.
우위 분석
이 전략의 가장 큰 장점은 스톱 라인지를 동적으로 조정하여 시장의 변동성에 따라 자동으로 리스크 을 수정할 수 있다는 것입니다. 스톱 라인지는 변동성이 확장되면 스톱 라인지도 커져 스톱 라인이 뚫릴 가능성을 줄여줍니다. 낮은 변동성이있는 시장에서는 스톱 라인지도 줄어듭니다.
고정된 스톱로즈 거리와는 달리, 이 방법은 트렌드를 추적하면서도, 단편적 손실을 효과적으로 제어할 수 있다. 이는 수익 공간을 보장하면서도, 위험 관리에 주의를 기울인다.
또한, 동향 판단과 함께, 이러한 상쇄 방식은 평형 지역에서 진동으로 인해 을 줄일 수 있습니다.
위험 분석
이 전략의 주요 위험은 포지션 보유 기간 동안 가격 단선이 뒤로 당겨져 HOP를 유발할 위험이 있다. 특히 ATR 주기가 너무 짧으면 HOP이 단기 변동의 영향을 완전히 필터링 할 수 없다.
또 다른 위험은, 급격한 상황에서는, 가격의 폭파 운동이 직접적으로 중지 라인을 뚫을 수 있다는 것입니다. 이 경우 더 큰 중지 배수를 설정해야하지만, 이윤의 공간을 줄일 수 있습니다.
마지막으로, 이 전략은 야간 거래와 상장 전 거래가 ATR 값에 미치는 영향을 고려하지 않습니다. 이것은 전략이 계산된 ATR 데이터가 상장 또는 상장 할 때 정확하지 않을 수 있습니다.
최적화 방향
이 전략은 다음과 같은 부분에서 최적화될 수 있습니다.
ATR 주기 변수를 최적화하여 다양한 시장에서 최적의 변수 조합을 테스트합니다.
고정 배수와 동적 변화 배수 설정의 수익률 비교
야간 거래와 사전 거래 데이터를 결합하여 ATR을 계산하여 오픈 가격의 폭락 영향을 줄입니다.
ATR 조건을 설정: ATR이 일정 수준에 도달한 후에만 활성화하여 낮은 변동률 시장의 불필요한 손실을 방지합니다.
더 많은 필터링 조건과 결합: 대차 트렌드, 양력 지표와 같은 정보
요약하다
최적의 ATR 스톱 로드 배수 전략은 동적으로 스톱 로드 거리를 조정하여 트렌드 추적과 위험 제어 사이의 효과적인 균형을 달성합니다. 고정 스톱 로드 거리에 비해 수익 공간을 보장하면서 단독 손실을 효과적으로 제한 할 수 있습니다.
물론, 잠재적인 위험, 예를 들어 가격 폭등, 과도한 감수성 상쇄 등은 주의해야 합니다. 우리는 여러 측면에서 전략의 안정성과 수익률을 향상시킬 수 있는 최적화를 계속할 수 있습니다.
/*backtest
start: 2024-01-01 00:00:00
end: 2024-01-31 23:59:59
period: 1h
basePeriod: 15m
exchanges: [{"eid":"Futures_Binance","currency":"BTC_USDT"}]
*/

//@version=4
//@author=Daveatt
//This source code is subject to the terms of the Mozilla Public License 2.0 at https://mozilla.org/MPL/2.0/

SystemName = "BEST ATR Stop Multiple Strategy"
TradeId = "BEST"

InitCapital = 100000
InitPosition = 100
InitCommission = 0.075
InitPyramidMax = 1
CalcOnorderFills = true
CalcOnTick = true
DefaultQtyType = strategy.fixed
DefaultQtyValue = strategy.fixed
Precision = 2
Overlay=true


strategy(title=SystemName, shorttitle=SystemName, overlay=Overlay )

fastSMAperiod = input(defval=15, title='Fast SMA', type=input.integer, minval=2, step=1)
slowSMAperiod = input(defval=45, title='Slow SMA', type=input.integer, minval=2, step=1)

src = close
// Calculate moving averages
fastSMA = sma(src, fastSMAperiod)
slowSMA = sma(src, slowSMAperiod)

// Calculate trading conditions
enterLong  = crossover(fastSMA, slowSMA)
enterShort = crossunder(fastSMA, slowSMA)

// trend states
since_buy  = barssince(enterLong)
since_sell = barssince(enterShort)
buy_trend  = since_sell > since_buy
sell_trend = since_sell < since_buy

is_signal = enterLong or enterShort

// get the entry price
entry_price = valuewhen(enterLong or enterShort, src, 0)

// Plot moving averages
plot(series=fastSMA, color=color.teal)
plot(series=slowSMA, color=color.orange)

// Plot the entries
plotshape(enterLong, style=shape.circle, location=location.belowbar, color=color.green, size=size.small)
plotshape(enterShort, style=shape.circle, location=location.abovebar, color=color.red, size=size.small)


///////////////////////////////
//======[ Trailing STOP ]======//
///////////////////////////////

// use SL?
useSL = input(true, "Use stop Loss")
// ATR multiple Stop
stop_atr_length         = input(14,title="ATR Length", minval=1, type=input.integer)
stop_atr_mult           = input(2,title="ATR Multiple", minval=0.05, step=0.1, type=input.float)

// Global STOP

stop_price = 0.0, stop_price := nz(stop_price[1])

// STOP ATR
var stop_atr      = 0.0
var entry_stop_atr   = 0.0

stop_atr          := nz(atr(stop_atr_length))

if enterLong or enterShort
    entry_stop_atr := stop_atr * stop_atr_mult

// display the ATR value multiple
plotshape(enterLong, title='ATR Long Stop value', style=shape.labelup,
 location=location.bottom, color=color.green, transp=0, text='', textcolor=color.navy, editable=true, size=size.small, show_last=1, size=size.small)

// var label atr_long_label = na
// var label atr_short_label = na
lapos_y_entry_up = lowest(30)
lapos_y_entry_dn = highest(30)

// text_label = "ATR value: " + tostring(stop_atr, '#.#') + "\n\nATR Multiple value: " + tostring(entry_stop_atr, '#.#')

// if enterLong

//     label.delete(atr_long_label)

//     atr_long_label := label.new(bar_index, lapos_y_entry_up, text=text_label,
//      xloc=xloc.bar_index, yloc=yloc.price, color=color.green, style=label.style_labelup, textcolor=color.white,
//      size=size.normal)

// if enterShort

//     label.delete(atr_short_label)

//     atr_short_label := label.new(bar_index, lapos_y_entry_dn, text=text_label,
//      xloc=xloc.bar_index, yloc=yloc.price, color=color.red, style=label.style_labeldown, textcolor=color.black,
//      size=size.normal)

// Determine trail stop loss prices
longStopPrice = 0.0, shortStopPrice = 0.0

longStopPrice := if useSL and buy_trend
    stopValue = entry_price - entry_stop_atr
else
    0

shortStopPrice := if useSL and sell_trend
    stopValue = entry_price + entry_stop_atr
else
    999999

//////////////////////////////////////////////////////////////////////////////////////////
//*** STOP LOSS HIT CONDITIONS TO BE USED IN ALERTS  ***//
//////////////////////////////////////////////////////////////////////////////////////////

cond_long_stop_loss_hit  = useSL and buy_trend and crossunder(low, longStopPrice[1])

cond_short_stop_loss_hit = useSL and sell_trend and crossover(high, shortStopPrice[1])


// Plot stop loss values for confirmation
plot(series=useSL and buy_trend and low >= longStopPrice
 ? longStopPrice : na,
 color=color.fuchsia, style=plot.style_cross,
 linewidth=2, title="Long Trail Stop")

plot(series=useSL and sell_trend and high <= shortStopPrice
 ? shortStopPrice : na,
 color=color.fuchsia, style=plot.style_cross,
 linewidth=2, title="Short Trail Stop")

close_long  = cond_long_stop_loss_hit
close_short = cond_short_stop_loss_hit

// Submit entry orders
strategy.entry(TradeId + " L", long=true, when=enterLong)
strategy.close(TradeId + " L", when=close_long)

//if (enterShort)
strategy.entry(TradeId + " S", long=false, when=enterShort)
strategy.close(TradeId + " S", when=close_short)