개요
역사적인 흐름 유도 전략은 시장의 추세 전환점을 식별하는 유동 지표를 사용하여 지수 이동 평균과 결합하여 거래 신호를 생성하여 유리한 상황을 잡기 위해 노력하고 있습니다. 이 전략은 유동 지표와 이동 평균을 사용하는 장점을 교묘하게 결합하여 시장의 흐름을 효과적으로 판단하고 거래 지침을 제공합니다.
원해해석
흐름 지표- 가격의 긍정 운동과 부정 운동을 분석하여 트렌드의 방향과 강도를 판단한다. 주요 파라미터는 주기 길이를 포함하고, 곱하기 및 하락 값을 포함한다.
지수 이동 평균- 마감 가격에 대한 지수 평준화, 더 유동적인 추세 판단을 제공합니다. 이동 평균의 주기가 길어질수록, 추세 판단은 더 안정적입니다.
이 전략은 흐름 지표를 사용하여 시장의 주요 트렌드 방향을 결정하고, 지표선이 경계를 통과하면 거래 신호를 발생시킨다. 이동 평균과 결합하여 필터링하여 잘못된 신호를 피한다. 구체적으로, 흐름 지표가 경계를 넘어 이동 평균보다 높은 가격으로 구매 신호를 발생시킨다. 흐름 지표가 경계를 넘어 이동 평균보다 낮은 가격으로 판매 신호를 발생시킨다.
우위 분석
- 유동 지표의 역전 인식 능력을 활용하여 잠재적인 트렌드 역전 기회를 적시에 잡을 수 있습니다.
- 이동 평균과 결합하여 신호 필터링을 사용하여 변동 시 잘못된 거래를 방지합니다.
- 매개 변수를 통해 최적화, 전략 민감도를 조정하여 다양한 시장 환경에 적용할 수 있습니다.
- 직관적 인 인터페이스와 명확한 거래 신호, 실판 작동을 용이하게
위험 분석
- 급격한 사건으로 인해 지표가 작동하지 않는 시스템 위험
- 지진이 발생했을 때 잘못된 신호가 더 많이 나타날 수 있습니다.
- 변수 설정이 잘못되면 너무 급진적이거나 보수적이 될 수 있습니다.
- 단편적 손실을 조절하기 위한 적절한 스톱으로
리스크에 대한 대응은 부가적인 필터를 추가하여 여러 지표 판단과 최적화된 파라미터 설정을 결합하여 적절한 스톱로드를 설정하여 대응할 수 있다.
최적화 방향
- 다른 이동 평균 유형을 시도하여 가장 잘 맞는 조합을 찾으십시오.
- 최적의 수익률을 달성하기 위해 흐름 지표와 이동 평균의 매개 변수를 조정합니다.
- 다중 시간 주기의 전략 안정성을 검사
- 브린 밴드 같은 지표 필터링 신호를 추가합니다.
- 특정 품종에 대한 파라미터 미세 조정
요약하다
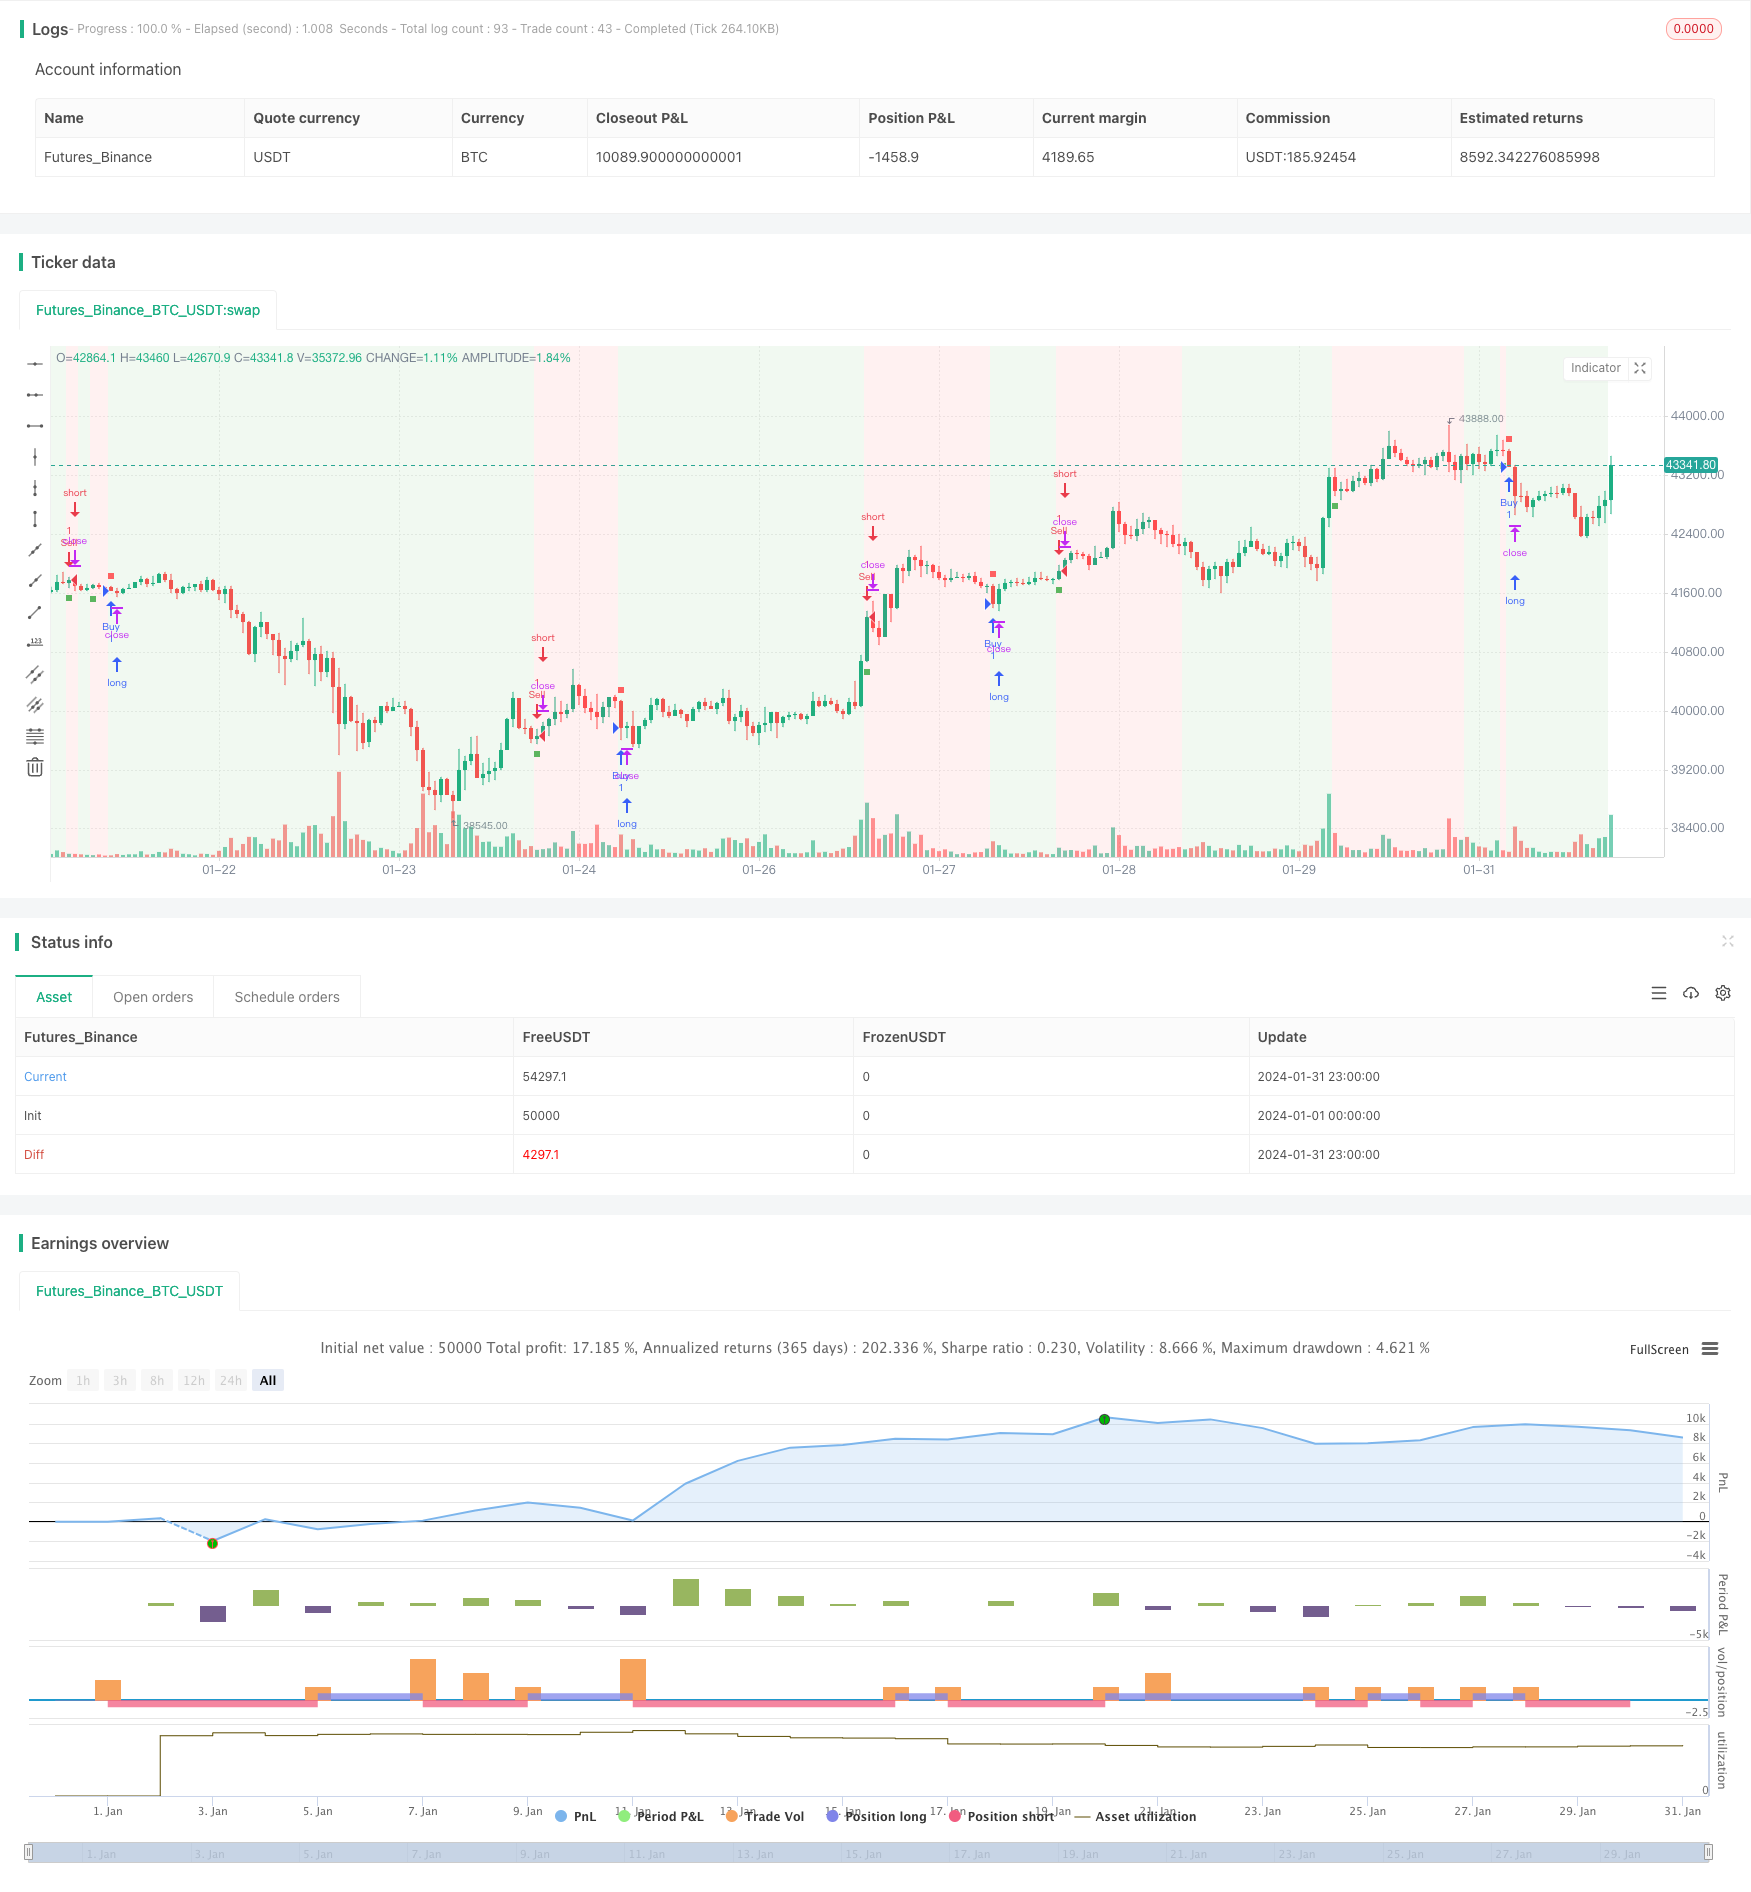
역사적인 동향 변동 전략은 전반적으로 안정적이며, 잠재적인 추세 반전을 포착하면서도 필터링 능력을 가지고 있다. 변수 최적화 및 위험 관리의 보조로 이 전략은 우수한 수익률을 얻을 수 있다. 거래자는 실제 디스크에서 모의하는 전체 검증을 수행하고, 이 전략의 기초에 혁신적인 확장을 시도할 수 있다.
/*backtest
start: 2024-01-01 00:00:00
end: 2024-01-31 23:59:59
period: 1h
basePeriod: 15m
exchanges: [{"eid":"Futures_Binance","currency":"BTC_USDT"}]
*/

// This work is licensed under a Attribution-NonCommercial-ShareAlike 4.0 International (CC BY-NC-SA 4.0) https://creativecommons.org/licenses/by-nc-sa/4.0/
// © AstroHub

//@version=5
strategy("Vortex Strategy [AstroHub]", shorttitle="VS [AstroHub]", overlay=true)

// Vortex Indicator Settings
length = input(14, title="Length", group ="AstroHub Vortex Strategy", tooltip="Number of bars used in the Vortex Indicator calculation. Higher values may result in smoother but slower responses to price changes.")
mult = input(1.0, title="Multiplier", group ="AstroHub Vortex Strategy", tooltip="Multiplier for the Vortex Indicator calculation. Adjust to fine-tune the sensitivity of the indicator to price movements.")
threshold = input(0.5, title="Threshold",group ="AstroHub Vortex Strategy",  tooltip="Threshold level for determining the trend. Higher values increase the likelihood of a trend change being identified.")
emaLength = input(20, title="EMA Length", group ="AstroHub Vortex Strategy", tooltip="Length of the Exponential Moving Average (EMA) used in the strategy. A longer EMA may provide a smoother trend indication.")

// Calculate Vortex Indicator components
a = math.abs(close - close[1])
b = close - ta.sma(close, length)
shl = ta.ema(b, length)
svl = ta.ema(a, length)

// Determine trend direction
upTrend = shl > svl
downTrend = shl < svl

// Define Buy and Sell signals
buySignal = ta.crossover(shl, svl) and close > ta.ema(close, emaLength) and (upTrend != upTrend[1])
sellSignal = ta.crossunder(shl, svl) and close < ta.ema(close, emaLength) and (downTrend != downTrend[1])

// Execute strategy based on signals
strategy.entry("Sell", strategy.short, when=buySignal)
strategy.entry("Buy", strategy.long, when=sellSignal)

// Background color based on the trend
bgcolor(downTrend ? color.new(color.green, 90) : upTrend ? color.new(color.red, 90) : na)

// Plot Buy and Sell signals with different shapes and colors
buySignal1 = ta.crossover(shl, svl) and close > ta.ema(close, emaLength)
sellSignal1 = ta.crossunder(shl, svl) and close < ta.ema(close, emaLength)

plotshape(buySignal1, style=shape.square, color=color.new(color.green, 10), size=size.tiny, location=location.belowbar, title="Buy Signal")
plotshape(sellSignal1, style=shape.square, color=color.new(color.red, 10), size=size.tiny, location=location.abovebar, title="Sell Signal")
plotshape(buySignal1, style=shape.square, color=color.new(color.green, 90), size=size.small, location=location.belowbar, title="Buy Signal")
plotshape(sellSignal1, style=shape.square, color=color.new(color.red, 90), size=size.small, location=location.abovebar, title="Sell Signal")