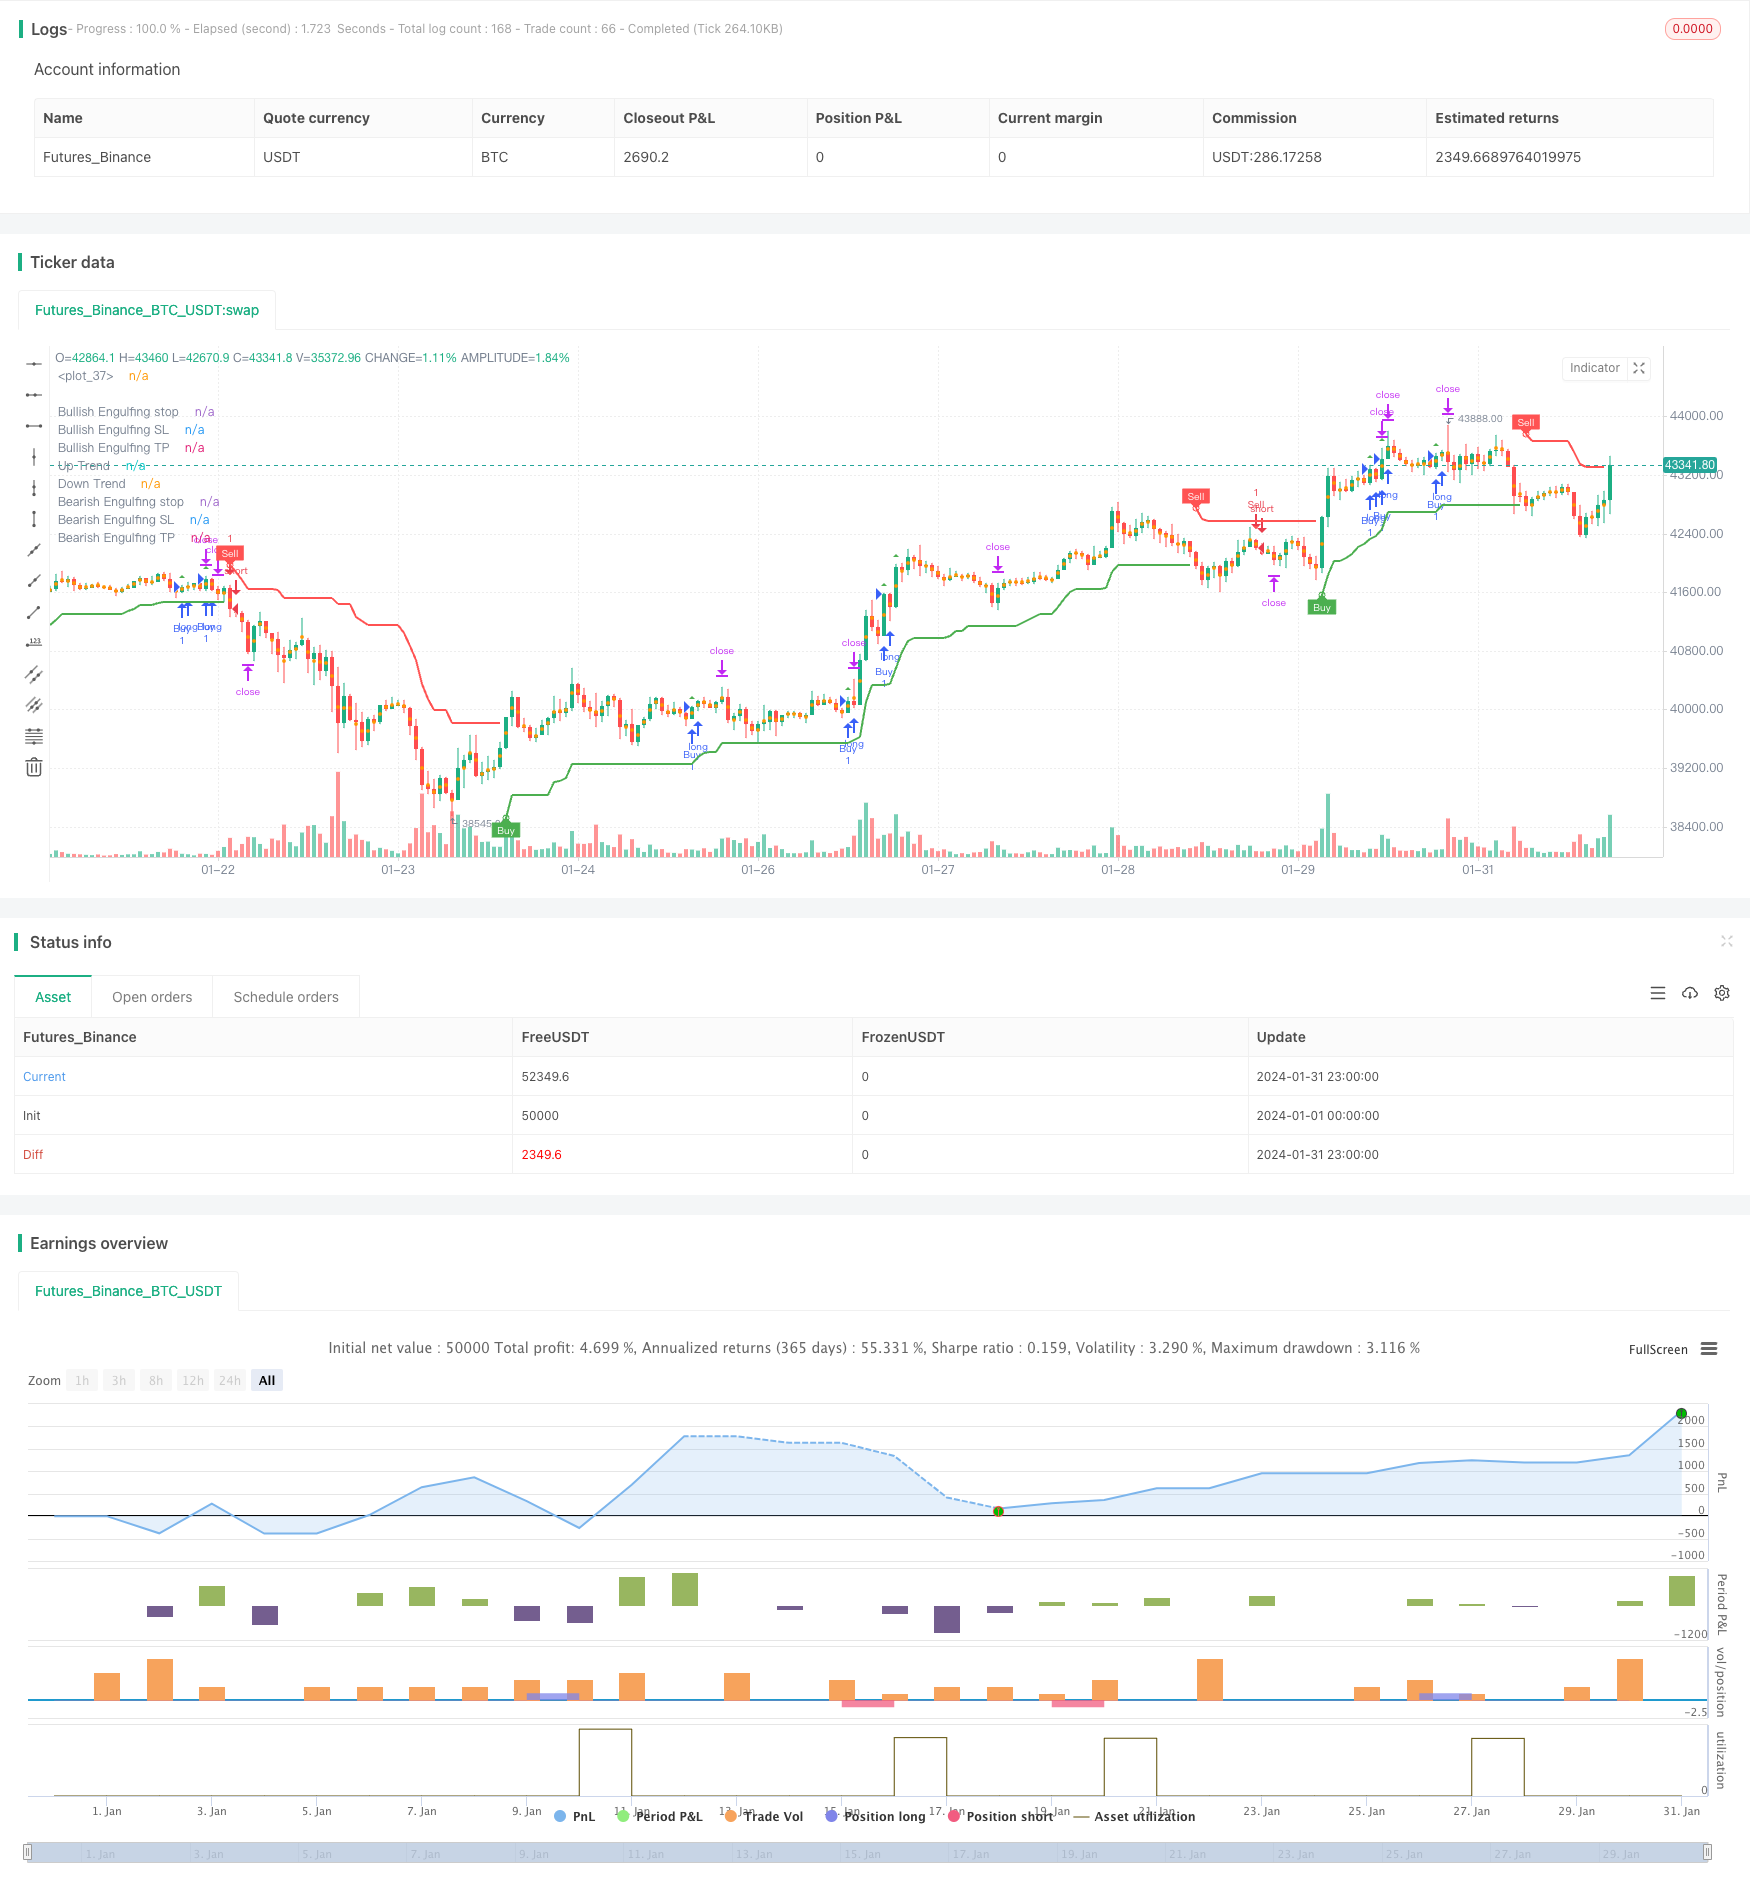
개요
동적 삼키기 트렌드 전략은 삼키기 형태에 따라 트렌드 방향에서 거래하는 전략이다. 이 전략은 평균 실제 변동 범위 ((ATR) 를 사용하여 시장의 변동성을 식별하고, 슈퍼 트렌드 지표는 시장의 경향 방향을 판단하고, 삼키기 형태와 일치하는 경우 다중 하락 작업을 수행한다.
전략 원칙
- ATR을 계산해 시장의 변동성을 측정합니다.
- 슈퍼 트렌드 지표를 계산하여 시장의 주요 트렌드 방향을 판단한다.
- 다단시장과 빈단시장 조건을 정의한다.
- 트렌드 방향에 부합하는 다중 헤드 흡수 ((상향 트렌드에서) 와 공허 흡수 ((하향 트렌드에서) 형태를 식별한다.
- 삼키기 형태에 따라 스톱 로즈와 스톱 포스트를 계산한다.
- 삼키는 형태를 인식하고 트렌드 방향과 일치하는 경우, 더하거나 공백 작업을 수행하십시오.
- 가격이 스톱로스 (stop loss) 또는 스톱 포즈 (stop position) 에 도달했을 때, 평점을 둡니다.
- 그래프에서 삼키기 형태를 표시한다.
전략적 강점 분석
이 전략은 다음과 같은 장점을 가지고 있습니다.
- 포식 형태와 트렌드 식별 거래 신호를 결합하여 신호 품질을 향상시킵니다.
- 트렌드의 전환점을 식별하고, 타겟팅하는 작업.
- 더 많은 공백 신호를 더 명확하게 하고, 작동 시간을 더 쉽게 파악한다.
- 하지만, 이 전략은 동향을 따르면서도 위험을 통제합니다.
- 코드 프레임워크는 명확하고, 최적화 및 개선이 쉽다.
전략적 위험 분석
이 전략에는 몇 가지 위험도 있습니다.
- 삼킨 형태는 가짜 돌파구가 될 수 있으며, 잘못 인식하면 손실이 발생할 수 있다.
- 의 형태 변수들, 예를 들어 부피 크기와 시간 길이를 파악하는 데 어려움이 있습니다.
- 트렌드 판단 메커니즘이 완벽하지 않아 트렌드에 부합하지 않는 작업으로 이어질 수 있다.
- 스톱 로즈와 스톱 스테이지를 설정하는 것은 경험에 의존하며 너무 주관적일 수 있다.
- 효과는 변수 최적화에 의존하며, 많은 역사 데이터 검증이 필요합니다.
위와 같은 위험은 다음과 같은 방법으로 통제 및 개선될 수 있습니다.
- 다른 기술 지표와 결합하여 가짜 침투 신호를 필터링한다.
- 더 안정적인 변수 계산 방법을 이용하는 것, 예를 들어 ATR을 스스로 조정하는 것.
- 트렌드 판단 메커니즘의 신뢰성을 높여 기계 학습 모델을 도입하는 것.
- 유전적 알고리즘과 같은 방법을 사용하여 최적의 변수 조합을 찾습니다.
- 더 긴 시간 창에서 재검토하여 변수 안정성을 보장한다.
전략 최적화 방향
이 전략은 최적화할 수 있는 여지가 있습니다:
- 트렌드 판단의 정확성을 높이기 위해 기계 학습 모델을 도입할 수 있다.
- 새로운 형태 인식 방법과 결합하여 삼킨 형태의 인식 효과를 개선한다.
- 최신 스톱 스톱 손실 전략을 동적으로 사용하여 스톱 스톱 손실 지점을 최적화하십시오.
- 고주파 데이터에 기반하여 단선 운영에 더 적합한 삼키는 돌파 전략을 개발할 수 있다.
- 다양한 품종에 적용할 수 있다.
요약하다
전체적으로 볼 때, 동적 삼키기 트렌드 전략은 효과가 눈에 띄는 삼키기 형태와 정밀한 트렌드 판단을 결합하여 입시 신호 정밀도, 스톱 스톱 손실 합리적인 거래 전략을 형성한다. 응용 과정에서, 매개 변수 최적화, 위험 제어 및 새로운 기술을 도입하여 전략의 안정성과 수익성을 더욱 강화 할 수 있다. 이 전략의 프레임 워크는 명확하고, 매우 강력한 보편성이 있으며, 깊이 있는 연구와 응용에 가치가 있다.
전략 소스 코드
/*backtest
start: 2024-01-01 00:00:00
end: 2024-01-31 23:59:59
period: 1h
basePeriod: 15m
exchanges: [{"eid":"Futures_Binance","currency":"BTC_USDT"}]
*/

// This source code is subject to the terms of the Mozilla Public License 2.0 at https://mozilla.org/MPL/2.0/
// © Malikdrajat


//@version=4
strategy("Engulfing with Trend", overlay=true)

Periods = input(title="ATR Period", type=input.integer, defval=10)
src = input(hl2, title="Source")
Multiplier = input(title="ATR Multiplier", type=input.float, step=0.1, defval=3.0)
changeATR= input(title="Change ATR Calculation Method ?", type=input.bool, defval=true)
showsignals = input(title="Show Buy/Sell Signals ?", type=input.bool, defval=true)
highlighting = input(title="Highlighter On/Off ?", type=input.bool, defval=true)

atr2 = sma(tr, Periods)
atr= changeATR ? atr(Periods) : atr2

up=src-(Multiplier*atr)
up1 = nz(up[1],up)
up := close[1] > up1 ? max(up,up1) : up
dn=src+(Multiplier*atr)
dn1 = nz(dn[1], dn)
dn := close[1] < dn1 ? min(dn, dn1) : dn

trend = 1
trend := nz(trend[1], trend)
trend := trend == -1 and close > dn1 ? 1 : trend == 1 and close < up1 ? -1 : trend

upPlot = plot(trend == 1 ? up : na, title="Up Trend", style=plot.style_linebr, linewidth=2, color=color.green)
buySignal = trend == 1 and trend[1] == -1
plotshape(buySignal ? up : na, title="UpTrend Begins", location=location.absolute, style=shape.circle, size=size.tiny, color=color.green, transp=0)
plotshape(buySignal and showsignals ? up : na, title="Buy", text="Buy", location=location.absolute, style=shape.labelup, size=size.tiny, color=color.green, textcolor=color.white, transp=0)
dnPlot = plot(trend == 1 ? na : dn, title="Down Trend", style=plot.style_linebr, linewidth=2, color=color.red)
sellSignal = trend == -1 and trend[1] == 1
plotshape(sellSignal ? dn : na, title="DownTrend Begins", location=location.absolute, style=shape.circle, size=size.tiny, color=color.red, transp=0)
plotshape(sellSignal and showsignals ? dn : na, title="Sell", text="Sell", location=location.absolute, style=shape.labeldown, size=size.tiny, color=color.red, textcolor=color.white, transp=0)
mPlot = plot(ohlc4, title="", style=plot.style_circles, linewidth=0)
longFillColor = highlighting ? (trend == 1 ? color.green : color.white) : color.white
shortFillColor = highlighting ? (trend == -1 ? color.red : color.white) : color.white
fill(mPlot, upPlot, title="UpTrend Highligter", color=longFillColor)
fill(mPlot, dnPlot, title="DownTrend Highligter", color=shortFillColor)
alertcondition(buySignal, title="SuperTrend Buy", message="SuperTrend Buy!")
alertcondition(sellSignal, title="SuperTrend Sell", message="SuperTrend Sell!")
changeCond = trend != trend[1]
alertcondition(changeCond, title="SuperTrend Direction Change", message="SuperTrend has changed direction!")

// Define Downtrend and Uptrend conditions
downtrend = trend == -1
uptrend = trend == 1


// Engulfing
boringThreshold = input(25, title="Boring Candle Threshold (%)", minval=1, maxval=100, step=1)
engulfingThreshold = input(50, title="Engulfing Candle Threshold (%)", minval=1, maxval=100, step=1)
stopLevel = input(200, title="Stop Level (Pips)", minval=1)


// Boring Candle (Inside Bar) and Engulfing Candlestick Conditions
isBoringCandle = abs(open[1] - close[1]) * 100 / abs(high[1] - low[1]) <= boringThreshold
isEngulfingCandle = abs(open - close) * 100 / abs(high - low) <= engulfingThreshold

// Bullish and Bearish Engulfing Conditions
bullEngulfing = uptrend and close[1] < open[1] and close > open[1] and not isBoringCandle and not isEngulfingCandle
bearEngulfing = downtrend and close[1] > open[1] and close < open[1] and not isBoringCandle and not isEngulfingCandle

// Stop Loss, Take Profit, and Entry Price Calculation
bullStop = close + (stopLevel * syminfo.mintick)
bearStop = close - (stopLevel * syminfo.mintick)
bullSL = low
bearSL = high
bullTP = bullStop + (bullStop - low)
bearTP = bearStop - (high - bearStop)

// Entry Conditions
enterLong = bullEngulfing and uptrend
enterShort = bearEngulfing and downtrend

// Exit Conditions
exitLong = crossover(close, bullTP) or crossover(close, bullSL)
exitShort = crossover(close, bearTP) or crossover(close, bearSL)

// Check if exit conditions are met by the next candle
exitLongNextCandle = exitLong and (crossover(close[1], bullTP[1]) or crossover(close[1], bullSL[1]))
exitShortNextCandle = exitShort and (crossover(close[1], bearTP[1]) or crossover(close[1], bearSL[1]))

// Strategy Execution
strategy.entry("Buy", strategy.long, when=enterLong )
strategy.entry("Sell", strategy.short, when=enterShort )

// Exit Conditions for Long (Buy) Positions
if (bullEngulfing and not na(bullTP) and not na(bullSL))
    strategy.exit("Exit Long", from_entry="Buy", stop=bullSL, limit=bullTP)

// Exit Conditions for Short (Sell) Positions
if (bearEngulfing and not na(bearTP) and not na(bearSL))
    strategy.exit("Exit Short", from_entry="Sell", stop=bearSL, limit=bearTP)

// Plot Shapes and Labels
plotshape(bullEngulfing, style=shape.triangleup, location=location.abovebar, color=color.green)
plotshape(bearEngulfing, style=shape.triangledown, location=location.abovebar, color=color.red)

// Determine OP, SL, and TP
plot(bullEngulfing ? bullStop : na, title="Bullish Engulfing stop", color=color.red, linewidth=3, style=plot.style_linebr)
plot(bearEngulfing ? bearStop : na, title="Bearish Engulfing stop", color=color.red, linewidth=3, style=plot.style_linebr)
plot(bullEngulfing ? bullSL : na, title="Bullish Engulfing SL", color=color.red, linewidth=3, style=plot.style_linebr)
plot(bearEngulfing ? bearSL : na, title="Bearish Engulfing SL", color=color.red, linewidth=3, style=plot.style_linebr)
plot(bullEngulfing ? bullTP : na, title="Bullish Engulfing TP", color=color.green, linewidth=3, style=plot.style_linebr)
plot(bearEngulfing ? bearTP : na, title="Bearish Engulfing TP", color=color.green, linewidth=3, style=plot.style_linebr)