개요
가격 변동 범위에 기반한 구매/판매 신호 필터링 전략 (Range Filter Buy Sell Signals Strategy) 은 매우 실용적인 양적 거래 전략이다. 가격의 변동 범위를 사용하여 구매/판매 신호를 필터링하여 낮은 변동 시장에서 가짜 신호를 줄이고 높은 변동 시장에서 신호 품질을 향상시킨다. 이 전략 이름은 전략의 주요 기능을 정확하게 요약한다.
전략 원칙
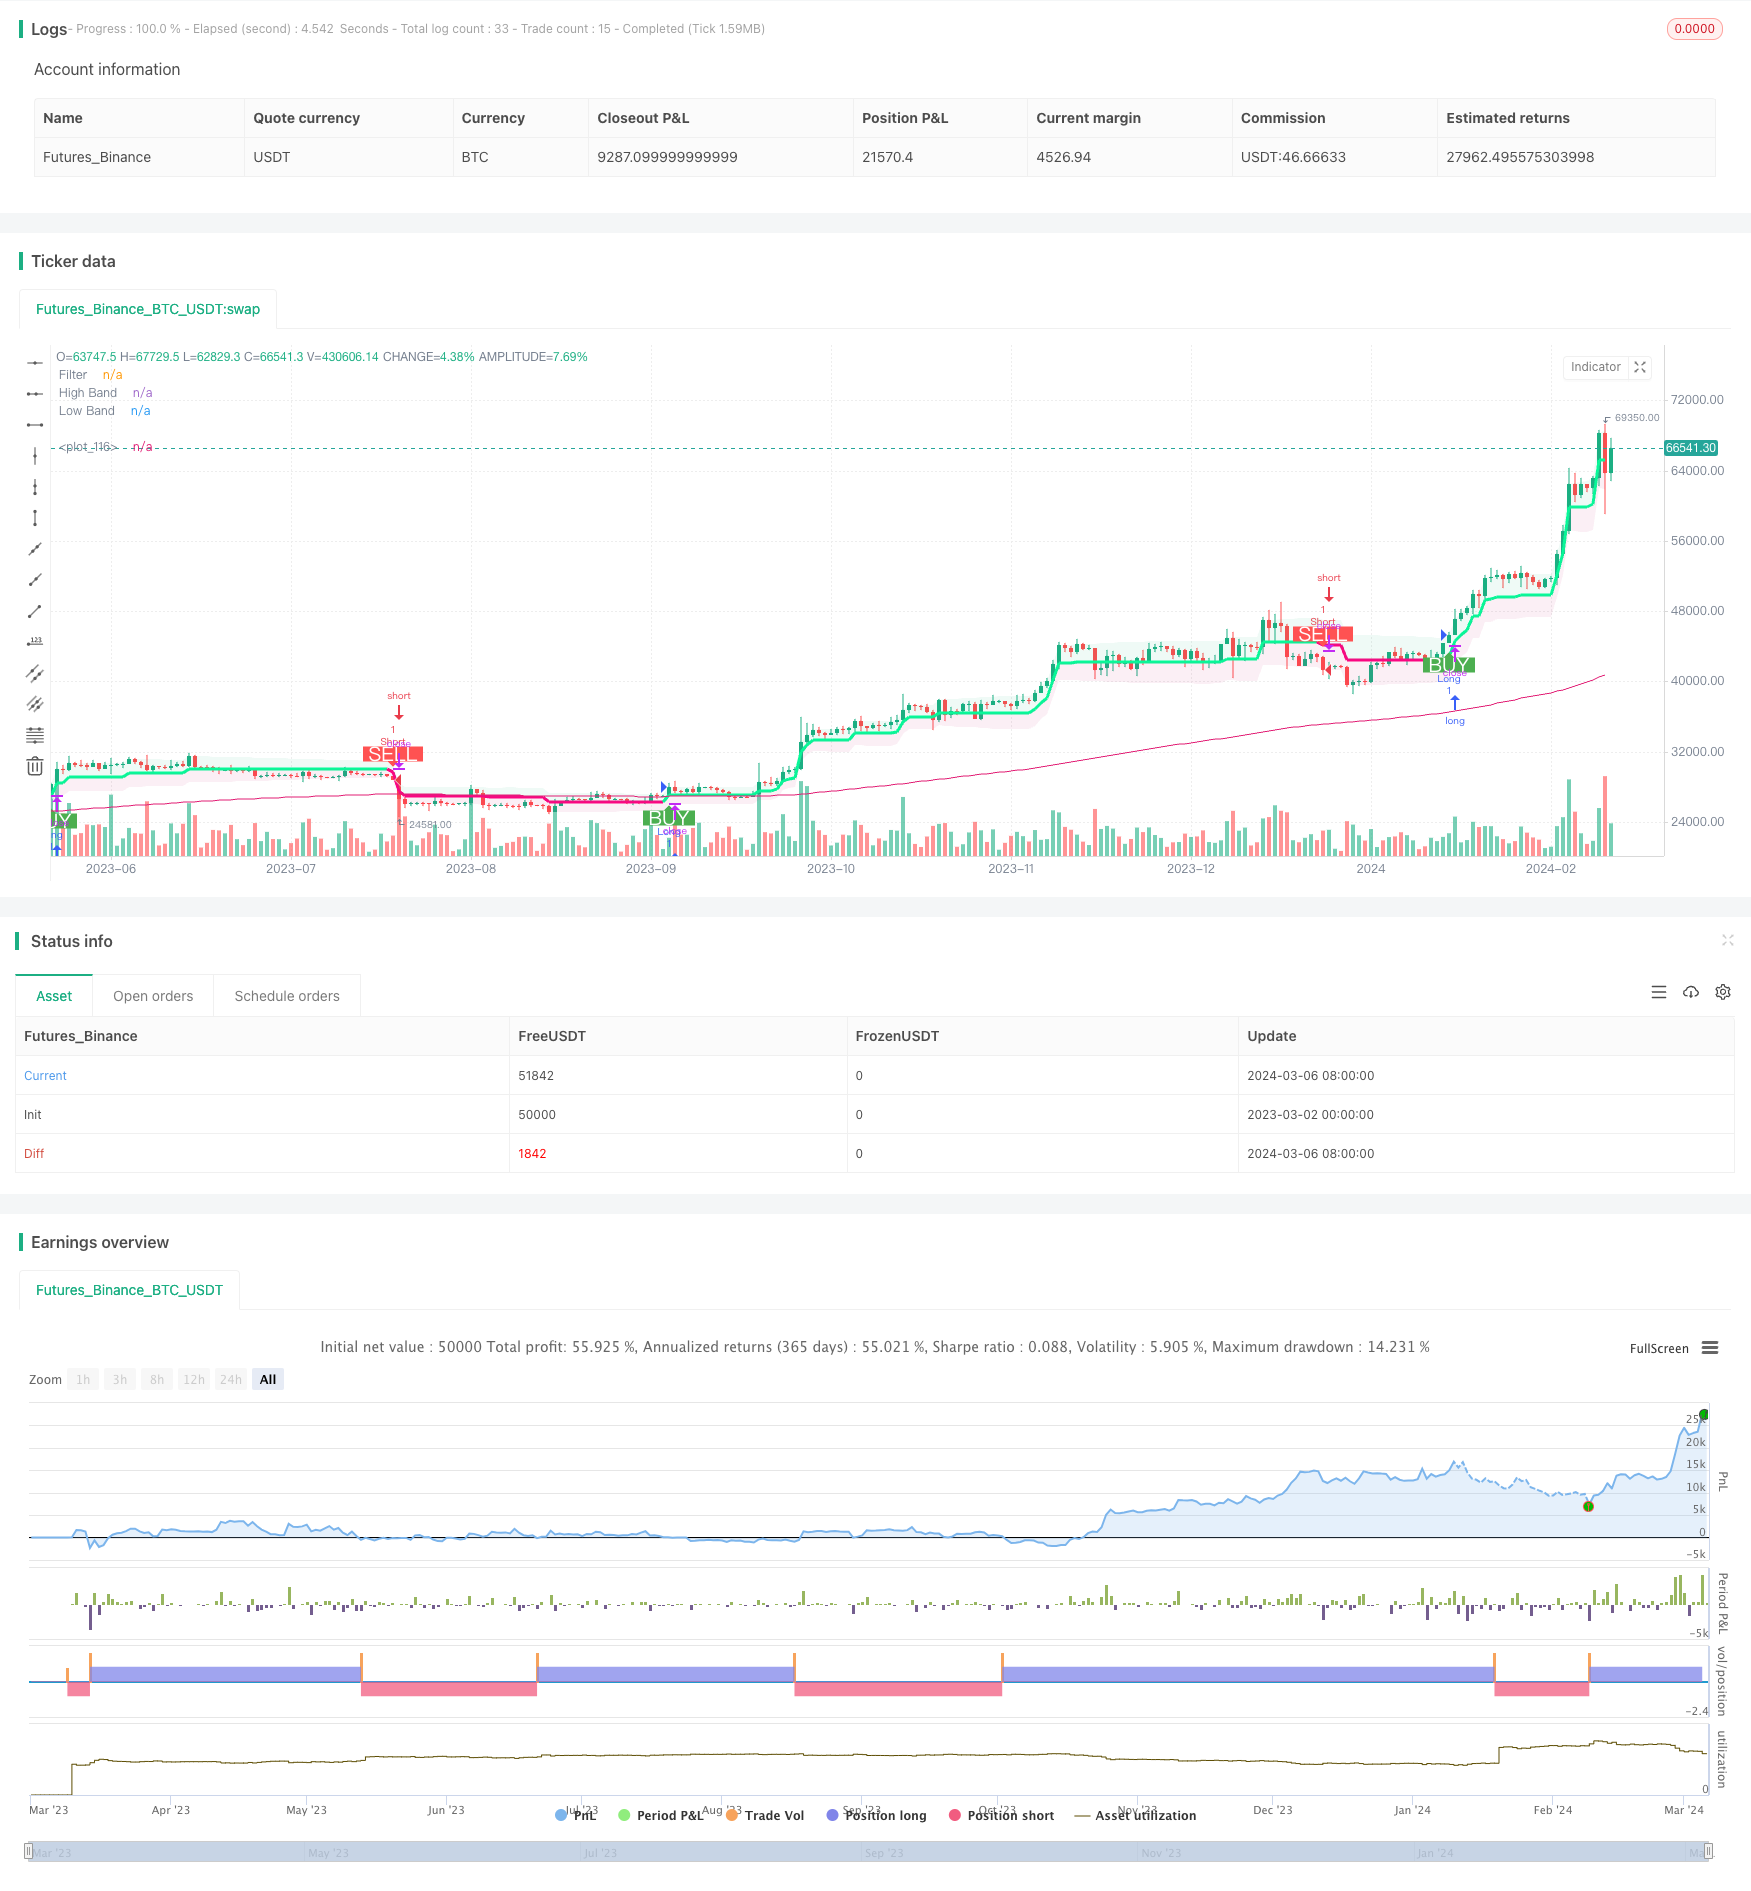
이 전략은 우선 특정 기간 동안의 자산 가격의 변동 범위를 계산한다. 구체적으로, 특정 기간 동안의 최고 가격과 최저 가격 사이의 차이를 계산하여 가격 변동의 폭을 결정한다.
이후, 그것은 구매 및 판매 신호를 생성한다. 그러나 모든 신호가 입장을 촉발하는 것은 아니며, 가격 변동 범위 필터링 조건을 충족해야 한다. 예를 들어, 가격 변동 범위가 깨졌을 때만 구매 신호를 발송한다.
이런 식으로, 이 전략은 낮은 변동성이 있는 시장 환경에서 대부분의 가짜 신호를 필터링하여 불필요한 입시를 피할 수 있다. 그리고 높은 변동성이 있을 때, 이 전략은 더 큰 방향의 움직임을 포착하여 그로부터 이익을 얻을 수 있다.
전략적 이점
이 전략의 가장 큰 장점은 신호의 필터링 강도를 동적으로 조정할 수 있다는 것입니다. 낮은 변동에서는 고품질의 신호만을 선택합니다. 높은 변동에서는 시장에서 제공하는 더 많은 기회를 잡을 수 있습니다.
고정 매개 변수 필터에 비해 이 전략은 더 똑똑하고 적응력이 강하다. 시장의 어떤 상태이든, 이 전략은 우수한 리스크 수익을 제공할 수 있다.
또한, 단일 거래 조건에 비해, 이 전략은 트렌드 방향 판단을 통합하여 더 신뢰할 수 있는 거래 신호를 제공합니다. 동시에, 이 전략은 개별 거래의 위험을 효과적으로 제어할 수 있는 손실 차단 기능을 갖추고 있습니다.
전략적 위험
이 전략의 주요 위험은 변동 범위 파라미터를 설정하는 데 있습니다. 너무 큰 범위 또는 너무 작은 범위가 설정되면 신호 품질과 수익 기회에 부정적인 영향을 미칠 수 있습니다.
또한, 단기간에 가격 변동이 강한 시장에서 이 전략의 수익 기회는 상대적으로 적습니다. 다른 주기적 시스템의 조합을 채택하는 것이 이 문제를 완화하는데 도움이 됩니다.
전략 최적화 방향
이 전략은 다음과 같은 몇 가지 측면에서 최적화될 수 있습니다.
자기 적응 변수 알고리즘을 사용하여 변동 범위 변수를 자동으로 최적화하여 더 지능적이고 동적으로 만듭니다.
시장의 불안정에서 벗어나기 위해 대주기 트렌드에 기반한 필터링 규칙을 추가합니다.
이 전략은 여러 주기를 결합하여 시스템을 형성하고 전체의 안정성을 향상시킵니다.
기계 학습 알고리즘을 추가하여 파라미터 설정 및 필터링 규칙의 효과를 향상시킵니다.
요약하다
가격 변동 범위에 기반한 구매/판매 신호 필터링 전략은 매우 실용적이고 효과적인 양적 거래 전략이다. 필터링 강도를 동적으로 조정할 수 있으며, 다양한 시장 환경에서 최적의 위험 수익을 제공할 수 있다. 동시에, 이 전략에는 특히 변수 최적화 및 규칙 최적화 측면에서 많은 최적화 공간이 있다.
/*backtest
start: 2023-03-02 00:00:00
end: 2024-03-07 00:00:00
period: 1d
basePeriod: 1h
exchanges: [{"eid":"Futures_Binance","currency":"BTC_USDT"}]
*/

// This source code is subject to the terms of the Mozilla Public License 2.0 at https://mozilla.org/MPL/2.0/

// Credits to the original Script - Range Filter DonovanWall https://www.tradingview.com/script/lut7sBgG-Range-Filter-DW/
// This version is the old version of the Range Filter with less settings to tinker with

//@version=5
strategy(title='Range Filter - B&S Signals', shorttitle='[Doan]_RF-B&S Signals', overlay=true)

//-----------------------------------------------------------------------------------------------------------------------------------------------------------------
//Functions
//-----------------------------------------------------------------------------------------------------------------------------------------------------------------
longLossPerc = input.float(title='Long Stop Loss (%)', minval=0.0, step=0.1, defval=1) * 0.01
shortLossPerc = input.float(title='Short Stop Loss (%)', minval=0.0, step=0.1, defval=1) * 0.01

longTakePerc = input.float(title='Long Take(%)', minval=0.0, step=0.1, defval=1) * 0.01
shortTakePerc = input.float(title='Short Take (%)', minval=0.0, step=0.1, defval=1) * 0.01

emaLength = input.int(200, title="EMA Length")

// Determine stop loss price

//Range Size Function
rng_size(x, qty, n) =>
    wper = n * 2 - 1
    avrng = ta.ema(math.abs(x - x[1]), n)
    AC = ta.ema(avrng, wper) * qty
    rng_size = AC

//Range Filter Function
rng_filt(x, rng_, n) =>
    r = rng_
    var rfilt = array.new_float(2, x)
    array.set(rfilt, 1, array.get(rfilt, 0))
    if x - r > array.get(rfilt, 1)
        array.set(rfilt, 0, x - r)
    if x + r < array.get(rfilt, 1)
        array.set(rfilt, 0, x + r)
    rng_filt1 = array.get(rfilt, 0)

    hi_band = rng_filt1 + r
    lo_band = rng_filt1 - r
    rng_filt = rng_filt1
    [hi_band, lo_band, rng_filt]

//-----------------------------------------------------------------------------------------------------------------------------------------------------------------
//Inputs
//-----------------------------------------------------------------------------------------------------------------------------------------------------------------

//Range Source
rng_src = input(defval=close, title='Swing Source')

//Range Period
rng_per = input.int(defval=20, minval=1, title='Swing Period')

//Range Size Inputs
rng_qty = input.float(defval=3.5, minval=0.0000001, title='Swing Multiplier')

//Bar Colors
use_barcolor = input(defval=false, title='Bar Colors On/Off')

//-----------------------------------------------------------------------------------------------------------------------------------------------------------------
//Definitions
//-----------------------------------------------------------------------------------------------------------------------------------------------------------------

//Range Filter Values
[h_band, l_band, filt] = rng_filt(rng_src, rng_size(rng_src, rng_qty, rng_per), rng_per)

//Direction Conditions
var fdir = 0.0
fdir := filt > filt[1] ? 1 : filt < filt[1] ? -1 : fdir
upward = fdir == 1 ? 1 : 0
downward = fdir == -1 ? 1 : 0

//Trading Condition
longCond = rng_src > filt and rng_src > rng_src[1] and upward > 0 or rng_src > filt and rng_src < rng_src[1] and upward > 0
shortCond = rng_src < filt and rng_src < rng_src[1] and downward > 0 or rng_src < filt and rng_src > rng_src[1] and downward > 0

CondIni = 0
CondIni := longCond ? 1 : shortCond ? -1 : CondIni[1]
longCondition = longCond and CondIni[1] == -1
shortCondition = shortCond and CondIni[1] == 1

//Colors
filt_color = upward ? #05ff9b : downward ? #ff0583 : #cccccc
bar_color = upward and rng_src > filt ? rng_src > rng_src[1] ? #05ff9b : #00b36b : downward and rng_src < filt ? rng_src < rng_src[1] ? #ff0583 : #b8005d : #cccccc


ema = ta.ema(close, emaLength)

//-----------------------------------------------------------------------------------------------------------------------------------------------------------------
//Outputs
//-----------------------------------------------------------------------------------------------------------------------------------------------------------------
longStopPrice = strategy.position_avg_price * (1 - longLossPerc)
shortStopPrice = strategy.position_avg_price * (1 + shortLossPerc)

longTakePrice = strategy.position_avg_price * (1 + longTakePerc)
shortTakePrice = strategy.position_avg_price * (1 - shortTakePerc)

//Filter Plot
filt_plot = plot(filt, color=filt_color, linewidth=3, title='Filter', transp=67)

//Band Plots
h_band_plot = plot(h_band, color=color.new(#05ff9b, 100), title='High Band')
l_band_plot = plot(l_band, color=color.new(#ff0583, 100), title='Low Band')

//Band Fills
fill(h_band_plot, filt_plot, color=color.new(#00b36b, 92), title='High Band Fill')
fill(l_band_plot, filt_plot, color=color.new(#b8005d, 92), title='Low Band Fill')

//Bar Color
barcolor(use_barcolor ? bar_color : na)
// Entry
strategy.entry("Long", strategy.long, when=longCondition)
strategy.entry("Short", strategy.short, when=shortCondition)

plot(ema)

//Plot Buy and Sell Labels
plotshape(longCondition, title='Buy Signal', text='BUY', textcolor=color.white, style=shape.labelup, size=size.normal, location=location.belowbar, color=color.new(color.green, 0))
plotshape(shortCondition, title='Sell Signal', text='SELL', textcolor=color.white, style=shape.labeldown, size=size.normal, location=location.abovebar, color=color.new(color.red, 0))

//Alerts
alertcondition(longCondition, title='Buy Alert', message='BUY')
alertcondition(shortCondition, title='Sell Alert', message='SELL')