MACD, ADX 및 EMA200을 기반으로 한 다중 시간 프레임 트렌드 거래 전략

1
Follow
1782
Followers
개요
이 전략은 MACD, ADX 및 EMA200 지표를 기반으로 현재 시장의 추세와 동력을 판단하여 여러 시간 프레임에 따라 트렌드 거래를 수행합니다. 전략의 주요 아이디어는 MACD 지표를 사용하여 시장의 추세를 판단하고, ADX 지표는 트렌드 강도를 확인하며, EMA200은 트렌드 필터 조건으로 동시에 여러 시간 프레임을 사용하여 거래 기회를 더 많이 얻고 더 나은 수익 위험 비율을 얻습니다.
전략 원칙
- 트렌드 필터 조건으로 200일 지수 이동 평균 ((EMA200) 을 계산한다.
- 시장의 추세를 판단하기 위해 MACD 라인, 신호 라인 및 기둥 도표를 포함한 MACD 지표를 계산하십시오.
- 트렌드 강도를 확인하기 위해 실제 변동률 ((ATR) 과 방향 운동 지표 ((ADX) 를 계산한다.
- 다자 입시 조건: EMA200 상위, MACD 라인은 신호 라인 상위 및 0 이하, ADX는 25보다 크다.
- 공허 입시 조건: EMA 200 이하의 종결 가격, 신호선 이하의 MACD 선과 0 이상, ADX 25보다 크다.
- ATR을 사용하여 중지 손실과 중지 거리를 계산하고, 중지 손실은 1%이며, 중지 설정은 1.5%입니다.
- 다목조건이 충족될 때, 중지 단위 및 제한 가격 단위 방식으로 더 많은 일을 한다. 공수 조건이 충족될 때, 중지 단위 및 제한 가격 단위 방식으로 공백을 한다.
- 15분, 30분, 1시간 등 다양한 시간 프레임으로 전략을 테스트하여 최적의 거래 시간 프레임을 찾아보세요.
우위 분석
- 여러 지표가 결합되어 거래 결정을 내리는 것은 전략의 신뢰성과 안정성을 높이는 데 도움이 됩니다.
- 다중 시간 프레임 거래는 다양한 수준의 트렌드를 포착하여 더 많은 거래 기회를 얻을 수 있습니다.
- ATR을 사용하여 스톱로즈와 스톱로즈 거리를 계산하여 포지션을 동적으로 조정하여 위험을 제어 할 수 있습니다.
- 스톱로즈와 스톱<unk>은 합리적인 설정으로 전략의 수익과 위험의 비율을 높이는 데 도움이 됩니다.
- 코드 구조는 명확하고 이해하기 쉽고 최적화하기 쉽습니다.
위험 분석
- 이 전략은 추세 시장에 의존하고 있으며, 불안정한 시장에서는 좋지 않을 수 있다.
- 여러 지표에 대한 파라미터 설정은 다른 시장과 자산에 따라 최적화가 필요할 수 있으며, 그렇지 않으면 전략의 부실한 성과로 이어질 수 있습니다.
- 스톱로스 및 스톱<unk>은 고정되어 있으며 시장의 변화에 적응하지 못하여 손실이 증가하거나 이익이 감소 할 수 있습니다.
- 다중 시간 프레임 거래는 거래 빈도를 높여 거래 비용을 증가시킬 수 있습니다.
해결책:
- 적응성 파라미터 최적화를 도입하여 시장 변화에 따라 지표 파라미터를 자동으로 조정한다.
- 스톱 및 스톱을 동적으로 조정합니다. 예를 들어, 추적 스톱 또는 변화 스톱을 사용합니다.
- 재검토에서 거래 비용을 고려하고 최적의 시간 프레임과 거래 빈도를 선택하십시오.
최적화 방향
- 다른 트렌드 확인 지표들, 예를 들어, 브린 밴드, 평선 시스템 등이 도입되어 트렌드 판단의 정확도를 높일 수 있다.
- 동적 스톱 스톱 또는 변동율 기반 스톱 스톱을 사용하는 것과 같은 스톱 및 스톱 설정을 최적화하십시오.
- 거래 신호에 거래량, 시장 감정 등과 같은 필터 조건을 더 추가하여 신호 품질을 향상시킵니다.
- 다른 시장과 자산에 대한 최적화, 최적의 조합을 찾아내는 것.
- 기계 학습 알고리즘의 도입을 고려하여 시장 변화에 적응하고 전략의 적응성과 안정성을 향상 시키십시오.
이러한 최적화를 통해 전략의 융통성과 수익성을 높이고, 다양한 시장 환경에 더 잘 적응할 수 있다.
요약하다
이 전략은 MACD, ADX 및 EMA200와 같은 지표들을 결합하여 여러 시간 프레임에 따라 트렌드 거래를 수행함으로써 특정 장점과 가용성을 가지고 있습니다. 전략의 핵심은 트렌드 판단과 트렌드 강도를 확인하는 데 있습니다. 여러 지표의 공동 작용을 통해 트렌드 기회를 더 잘 잡을 수 있습니다. 동시에, 전략은 고정된 스톱 스톱을 사용하여 위험을 제어하는 데 도움이됩니다.
Source
Pine
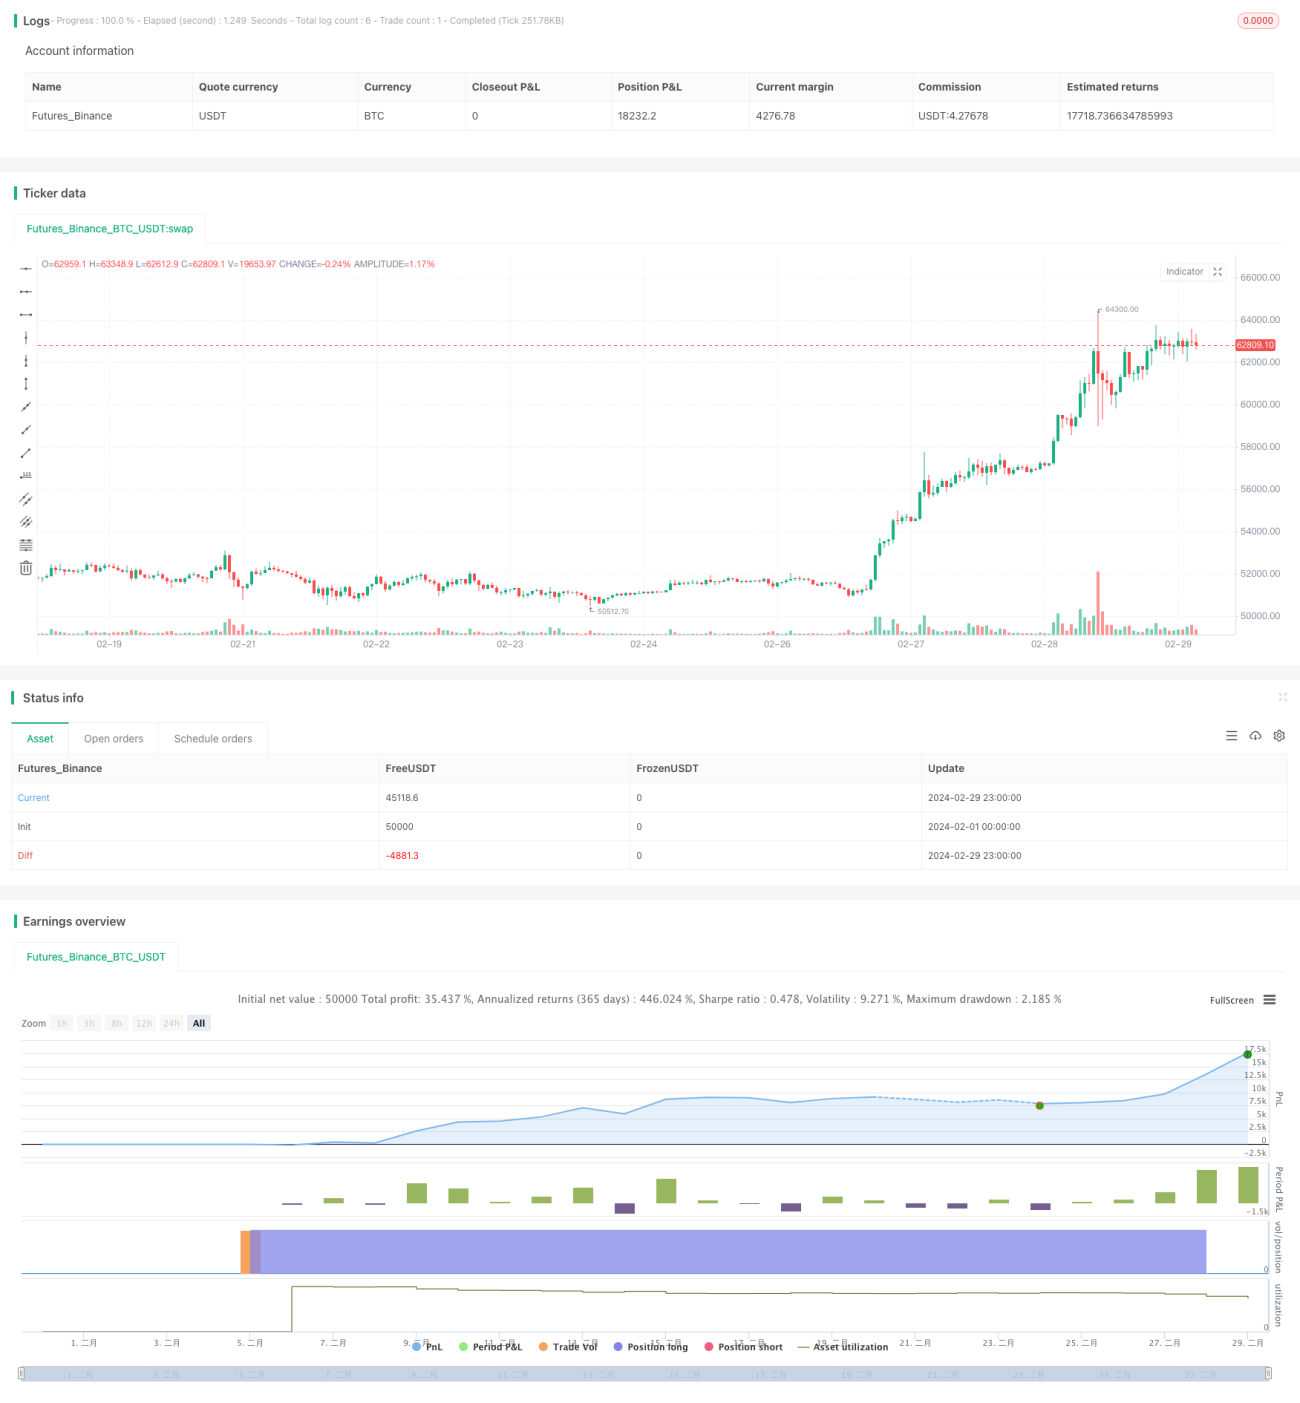
/*backtest
start: 2024-02-01 00:00:00
end: 2024-02-29 23:59:59
period: 1h
basePeriod: 15m
exchanges: [{"eid":"Futures_Binance","currency":"BTC_USDT"}]
*/

// This Pine Script™ code is subject to the terms of the Mozilla Public License 2.0 at https://mozilla.org/MPL/2.0/
// © colemanrumsey

//@version=5Related strategies
Comment
All comments (0)
No data
- 1