개요
이 전략의 주요 아이디어는 두 개의 다른 주기의 이동 평균을 사용하여 시장 회귀 후의 반발 기회를 잡는 것입니다. 가격이 장기 평균선 위에 있고 단기 평균선으로 회귀하는 경우, 전략은 더 많은 포지션을 열고, 가격이 단기 평균선에 다시 오르게하거나 중단 가격에 닿을 때 평소 포지션을합니다. 이 전략은 추세에서 회귀 구매 기회를 찾아 추세에서 이익을 얻으려고 노력합니다.
전략 원칙
- 두 개의 다른 주기들의 이동 평균을 계산하기 (MA1와 MA2), 여기서 MA1은 장기 평균선이고, MA2는 단기 평균선이다.
- 마1 위와 마2 아래의 마감 가격과 동시에 현재 포지션이 없으며, 현재는 설정된 거래 시간 범위에서 포지션을 여는 전략이다.
- 포지션 개시 가격인 buyPrice를 기록하고, 포지션 개시 가격인 stopPrice (i_stopPercent) 를 계산한다.
- 마이너스 2에 상쇄된 후 i_lowerClose가 false이거나, 마이너스가 스톱프라이스를 넘어서면 평형화한다.
- 만약 i_lowerClose가 true라면, 마이너스 2보다 높은 마이너스 2와 마이너스 2보다 낮은 마이너스 2의 마이너스 2의 마이너스 2의 마이너스 2의 마이너스 2의 마이너스 2의 마이너스 2의 마이너스 3의 마이너스 4의 마이너스 4의 마이너스 4의 마이너스 4의 마이너스 4의 마이너스 4의 마이너스 4의 마이너스 4의 마이너스 4의 마이너스 4의 마이너스 4의 마이너스 4의 마이너스 4의 마이너스 4의 마이너스 4의 마이너스 4의 마이너스 4의 마이너스 4의 마이너스 4의 마이너스 4의 마이너스 4의 마이너스 4의 마이너스 4의 마이너스 4의 마이너스 4의 마이너스 4의 마이너스 4의 마이너스 4의 마이너스 4의 마이너스 4의 마이너스 4의 마이너스 4의 마이너스 4의 마이너스 4의 마이너스 5의 마이너스 4의 마이너스 4의 마이너
전략적 이점
- 트렌드 추적: 가격과 장기 평균선의 위치 관계를 판단하여 현재의 전체 트렌드를 결정하고, 트렌드에서 진입 기회를 찾습니다.
- 반향 구매: 상승 추세에서 단기 평균선으로 가격 반향을 찾는 구매 기회, 구매 포인트의 가격비율을 높인다.
- 스톱 손실 보호: 스톱 손실 가격을 설정하고, 가격 역동성이 일정 규모에 도달하면 자동으로 포지션을 청산하여 하향 위험을 효과적으로 제어한다.
- 유연한 변수: 사용자는 자신의 취향에 따라, 유연하게 평균 주기를 설정할 수 있습니다.
전략적 위험
- 변수 최적화: 다양한 변수 설정은 전략에 큰 영향을 미치며, 최적의 변수 조합을 찾기 위해 다양한 시장 환경에서 변수 최적화 및 재검토가 필요합니다.
- 흔들림 시장: 흔들림 시장에서, 가격이 장기 단기 평균선 사이에 자주 변동하여, 전략이 빈번하게 마이너스 포지션을 열고, 거래 비용을 더 많이 잃게 할 수 있다.
- 트렌드 회전: 시장 트렌드가 변할 때, 전략이 연속으로 손실이 발생할 수 있는 상황. 이 시기는 다른 지표 또는 신호와 함께 트렌드 회전을 판단하고, 적절한 시기에 전략을 조정할 필요가 있다.
- 블랙 스윙 사건: 시장에서 예측할 수 없는 중대한 갑작스러운 사건이 발생하면, 가격의 급격한 변동으로 이어질 수 있으며, 손실 후 전략은 큰 손실을 입을 수 있습니다.
전략 최적화 방향
- 트렌드 판단: 포지션을 개시하기 전에 ADX와 같은 더 많은 트렌드 판단 지표를 도입하여 현재 트렌드의 강도와 방향을 확인하고 포지션 개시 신호의 정확성을 향상시킵니다.
- 다이내믹 스톱: 가격 변동률, ATR 등의 지표에 따라 스톱 지점을 다이내믹하게 조정하고, 가격 변동이 큰 경우 스톱을 적절히 느슨하게 하고, 가격 변동이 작은 경우 스톱을 강화한다.
- 포지션 관리: 시장 추세 강도, 가격 변동률 등의 요인에 따라 포지션 크기를 매번 동적으로 조정하고, 추세가 강하고 변동률이 중간일 때 포지션을 늘리고, 추세가 약하거나 변동률이 너무 높을 때 포지션을 줄인다.
- 다중 포지션 보호: 다중 포지션 양쪽의 신호를 동시에 모니터링하는 것을 고려하고, 다른 시장이나 주기에서 포지션을 보호하여 전략의 전반적인 위험을 낮추십시오.
요약하다
이동 평균 회전을 추적하는 전략은 두 개의 다른 주기적 평균선의 상대적 위치 관계를 통해 상승 추세에서 가격 회전을 할 수 있는 여러 기회를 포착한다. 이 전략은 트렌드형 시장에 적용되며, 적절한 매개 변수와 스톱로스를 설정하여 트렌드 상황에서 안정적인 수익을 얻을 수 있다. 그러나 불안한 시장과 트렌드 전환시에는 이 전략은 일정 위험에 직면한다. 더 많은 지표, 최적화된 포지션 관리 및 동적 스톱로스 방법 등을 도입함으로써 이 전략의 성과와 안정성을 더욱 향상시킬 수 있다.
전략 소스 코드
/*backtest
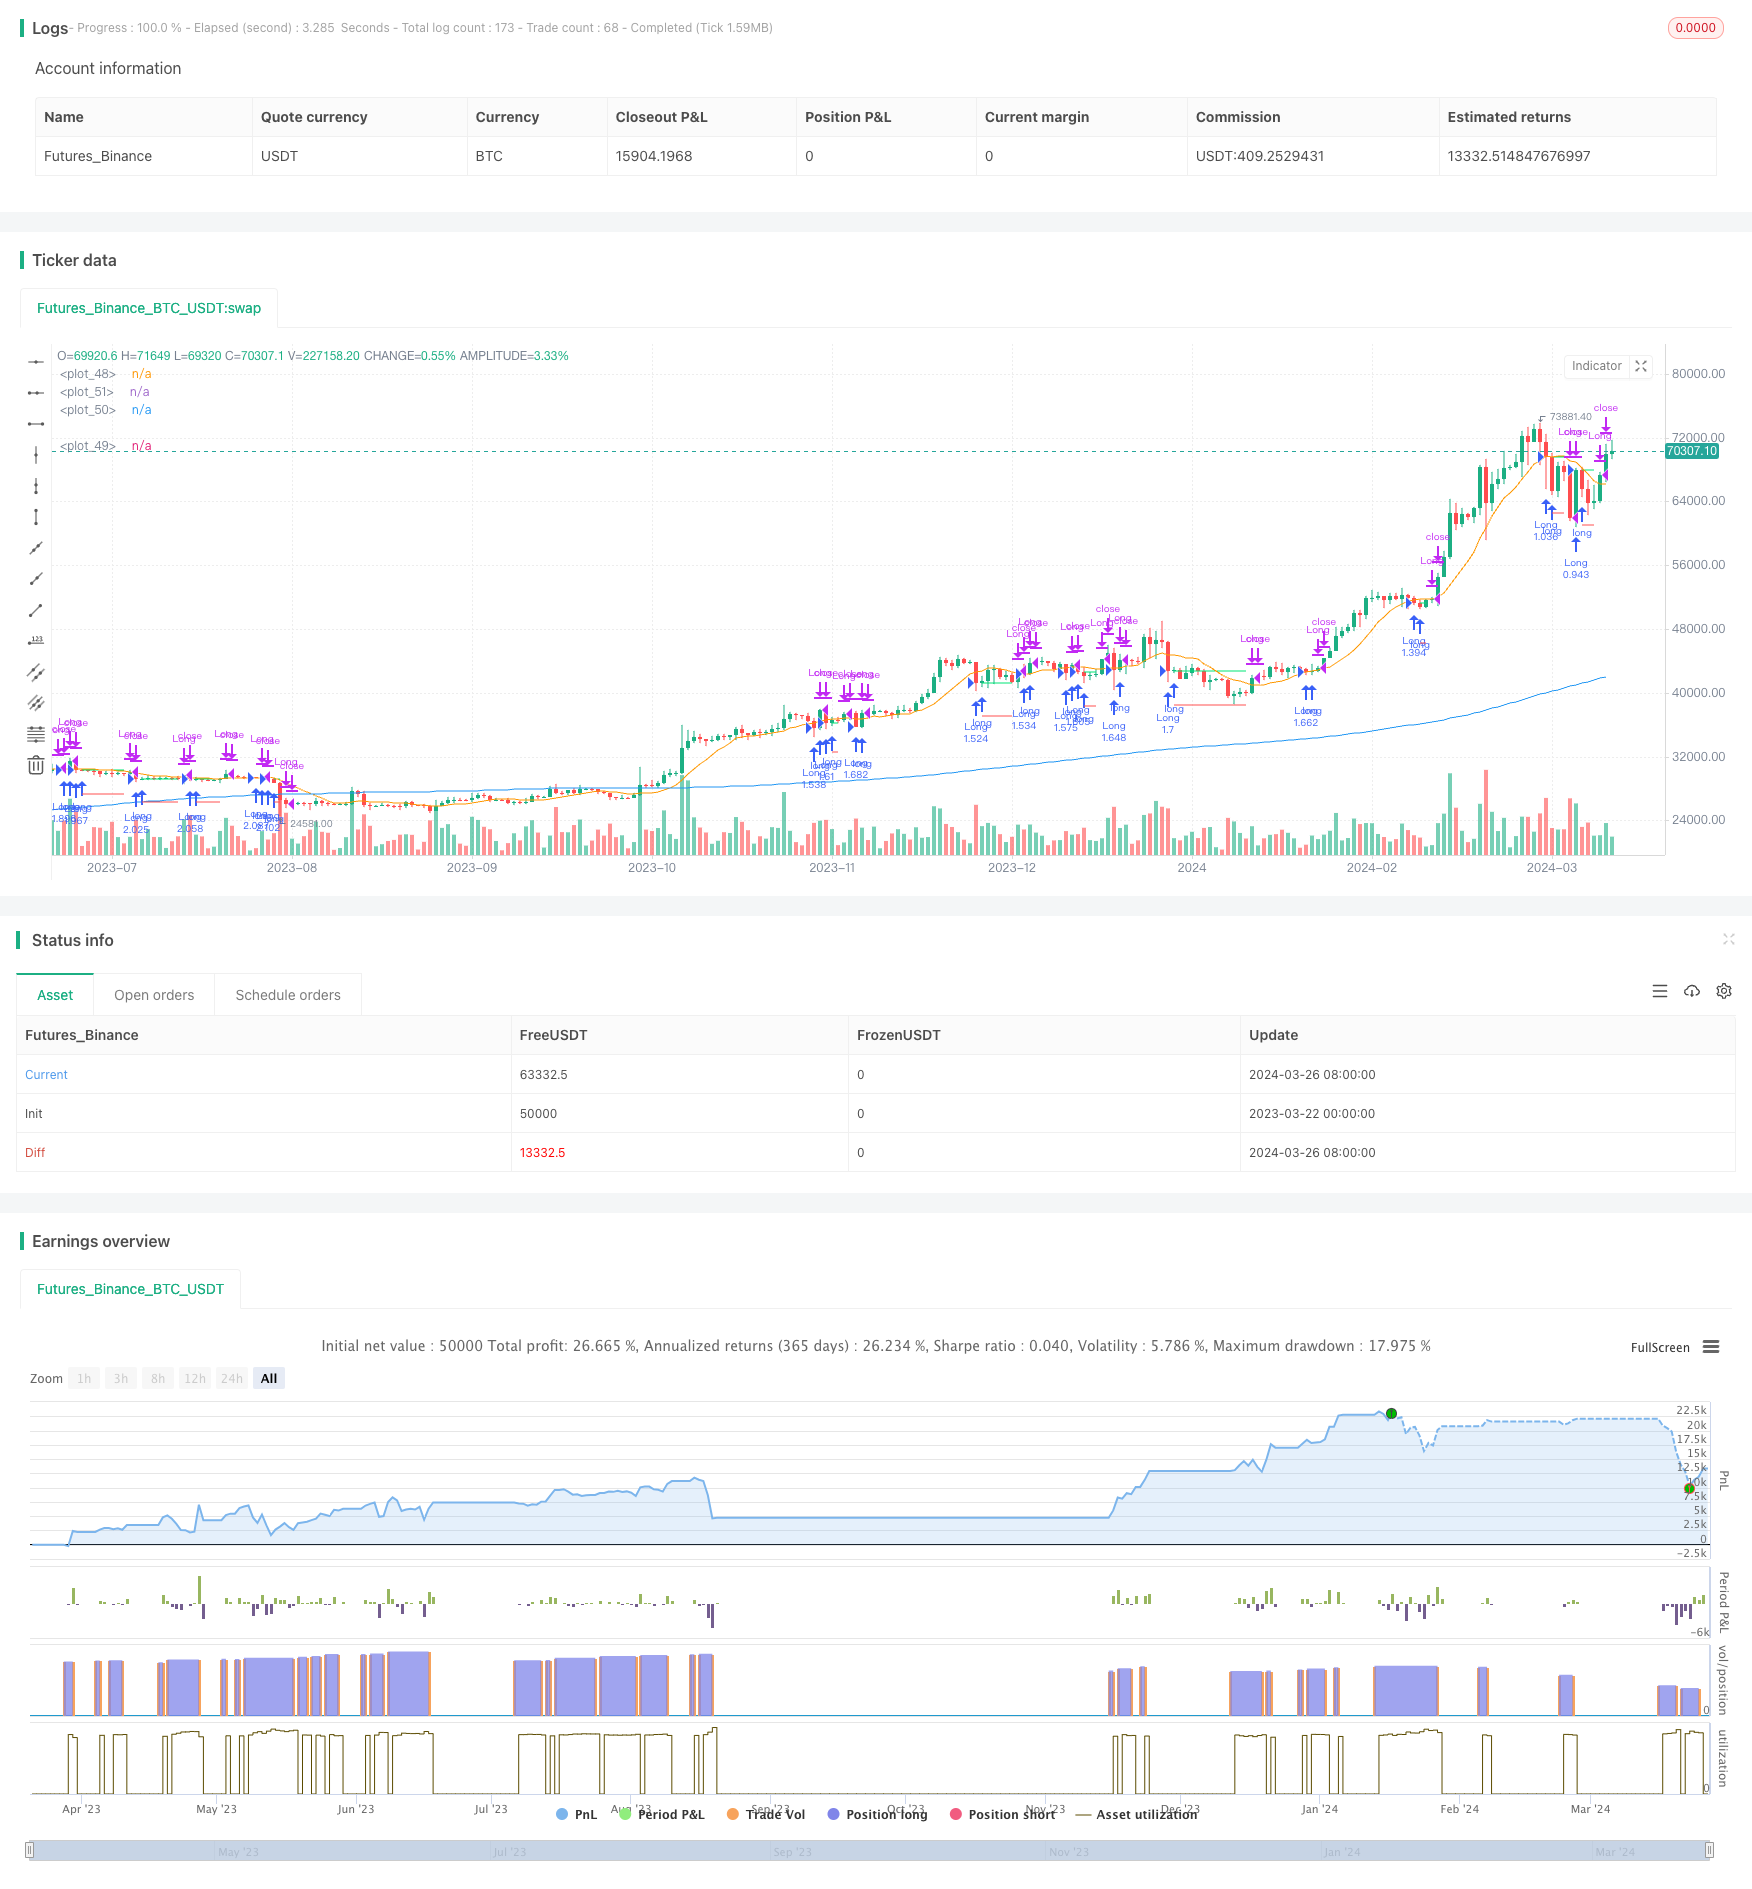
start: 2023-03-22 00:00:00
end: 2024-03-27 00:00:00
period: 1d
basePeriod: 1h
exchanges: [{"eid":"Futures_Binance","currency":"BTC_USDT"}]
*/
// This Pine Script™ code is subject to the terms of the Mozilla Public License 2.0 at https://mozilla.org/MPL/2.0/
// © contapessoal_ivan
// @version=5
strategy("Pullback Strategy",
overlay=true,
initial_capital=1000,
default_qty_type=strategy.percent_of_equity,
default_qty_value=100, // 100% of balance invested on each trade
commission_type=strategy.commission.cash_per_contract,
commission_value=0.005) // Interactive Brokers rate
// Get user input
i_ma1 = input.int(title="MA 1 Length", defval=200, step=10, group="Strategy Parameters", tooltip="Long-term MA")
i_ma2 = input.int(title="MA 2 Length", defval=10, step=10, group="Strategy Parameters", tooltip="Short-term MA")
i_stopPercent = input.float(title="Stop Loss Percent", defval=0.10, step=0.1, group="Strategy Parameters", tooltip="Failsafe Stop Loss Percent Decline")
i_lowerClose = input.bool(title="Exit On Lower Close", defval=false, group="Strategy Parameters", tooltip="Wait for a lower-close before exiting above MA2")
i_startTime = input(title="Start Filter", defval=timestamp("26 Jan 2023 00:00 +0000"), group="Time Filter", tooltip="Start date & time to begin searching for setups")
i_endTime = input(title="End Filter", defval=timestamp("26 Mar 2024 23:59 +0000"), group="Time Filter", tooltip="End date & time to stop searching for setups")
// Get indicator values
ma1 = ta.sma(close, i_ma1)
ma2 = ta.sma(close, i_ma2)
// Check filter(s)
f_dateFilter = true
// Check buy/sell conditions
var float buyPrice = 0
buyCondition = close > ma1 and close < ma2 and strategy.position_size == 0 and f_dateFilter
sellCondition = close > ma2 and strategy.position_size > 0 and (not i_lowerClose or close < low[1])
stopDistance = strategy.position_size > 0 ? ((buyPrice - close) / close) : na
stopPrice = strategy.position_size > 0 ? buyPrice - (buyPrice * i_stopPercent) : na
stopCondition = strategy.position_size > 0 and stopDistance > i_stopPercent
// Enter positions
if buyCondition
strategy.entry(id="Long", direction=strategy.long)
if buyCondition[1]
buyPrice := open
// Exit positions
if sellCondition or stopCondition
strategy.close(id="Long", comment="Exit" + (stopCondition ? "SL=true" : ""))
buyPrice := na
// Draw pretty colors
plot(buyPrice, color=color.lime, style=plot.style_linebr)
plot(stopPrice, color=color.red, style=plot.style_linebr, offset=-1)
plot(ma1, color=color.blue)
plot(ma2, color=color.orange)