
1
Follow
1802
Followers
개요
해당 전략은 거래량과 가격 돌파를 기반으로 한 동적 DCA(Dollar Cost Averaging) 전략입니다. 최근 가격 저점을 식별하고, 해당 저점을 돌파하면서 거래량이 증가할 때 포지션을 구축하기 시작합니다. 가격이 계속 하락하는 과정에서 전략은 미실현 손실 규모에 따라 각 진입 수량을 동적으로 조정하며, 설정된 총 진입 횟수에 도달할 때까지 반복합니다. 또한, 가격 하락 폭의 중앙값을 기준으로 익절 가격을 설정합니다.
전략 원리
ta.pivotlow()함수를 사용하여 최근 가격 저점을 식별하고 이를 지지선으로 삼습니다.- 과거 가격이 지지선을 돌파한 후 하락 폭을 계산하고, 그 중앙값을 안전 거리 및 익절 폭의 기준으로 사용합니다.
- 가격이 지지선을 돌파하고 상대 거래량이 설정된 배수보다 클 때 진입 신호가 발생합니다.
- 설정된 총 진입 횟수에 따라 총 자금을 동일 비율로 분할하고, 각 진입 시 현재 진입 횟수에 따라 진입 수량을 동적으로 조정하여 포지션이 기하급수적으로 증가하도록 합니다.
- 진입 과정에서 미실현 손실이 설정된 임계값에 도달하면 총 진입 횟수에 도달할 때까지 추가 매수합니다.
- 가격이 익절 가격까지 상승하면 모든 포지션을 청산합니다.
전략 장점
- 진입 수량 동적 조정: 가격 하락 과정에서 미실현 손실에 따라 각 진입 수량을 동적으로 조정하여 리스크를 통제함과 동시에 가격 반등 시 더 많은 이익을 얻을 수 있습니다.
- 과거 데이터를 참고한 파라미터 설정: 과거 가격이 지지선을 돌파한 후 하락 폭을 계산하고 그 중앙값을 안전 거리 및 익절 폭의 기준으로 삼아 전략 파라미터를 시장 실제 상황에 더욱 근접하게 만듭니다.
- 총 진입 횟수 제한: 총 진입 횟수를 설정하여 전략의 총 리스크 노출을 통제하고 과도한 추가 매수로 인한 손실을 방지합니다.
전략 리스크
- 지지선 무효화 리스크: 시장에 극단적인 흐름이 발생하여 가격이 지지선을 돌파한 후 지속적으로 크게 하락할 경우, 전략의 추가 매수 메커니즘이 큰 손실을 초래할 수 있습니다.
- 파라미터 설정 리스크: 전략의 성과는 파라미터 설정에 크게 의존하며, 파라미터가 적절하지 않을 경우 전략 성과가 저조할 수 있습니다.
- 익절 가격 설정 리스크: 익절 가격을 너무 높게 설정하면 일부 이익을 놓칠 수 있고, 너무 낮게 설정하면 조기 청산되어 가격 반등 기회를 충분히 활용하지 못할 수 있습니다.
전략 최적화 방향
- 추가 지표 도입: 진입 신호 판단에 RSI, MACD 등 더 많은 기술적 지표를 도입하여 신호의 정확성을 높일 수 있습니다.
- 자금 관리 최적화: 시장 변동성, 계정 리스크 허용 범위 등 요소에 따라 각 진입 시 자금 비율을 동적으로 조정하여 리스크를 더 잘 관리할 수 있습니다.
- 적응형 익절/손절: 시장 변동성 변화에 따라 익절 및 손절 폭을 동적으로 조정하여 시장 변화에 더 잘 적응할 수 있습니다.
요약
해당 전략은 진입 수량을 동적으로 조정하고 과거 데이터를 참고하여 파라미터를 설정함으로써 리스크를 통제하는 동시에 가격 반등 시 더 많은 이익을 얻고자 합니다. 그러나 전략의 성과는 파라미터 설정과 시장 상황에 크게 의존하므로 여전히 일정한 리스크가 존재합니다. 추가 지표 도입, 자금 관리 최적화, 적응형 익절/손절 등을 통해 전략의 성과를 더욱 개선할 수 있습니다.
Source
Pine
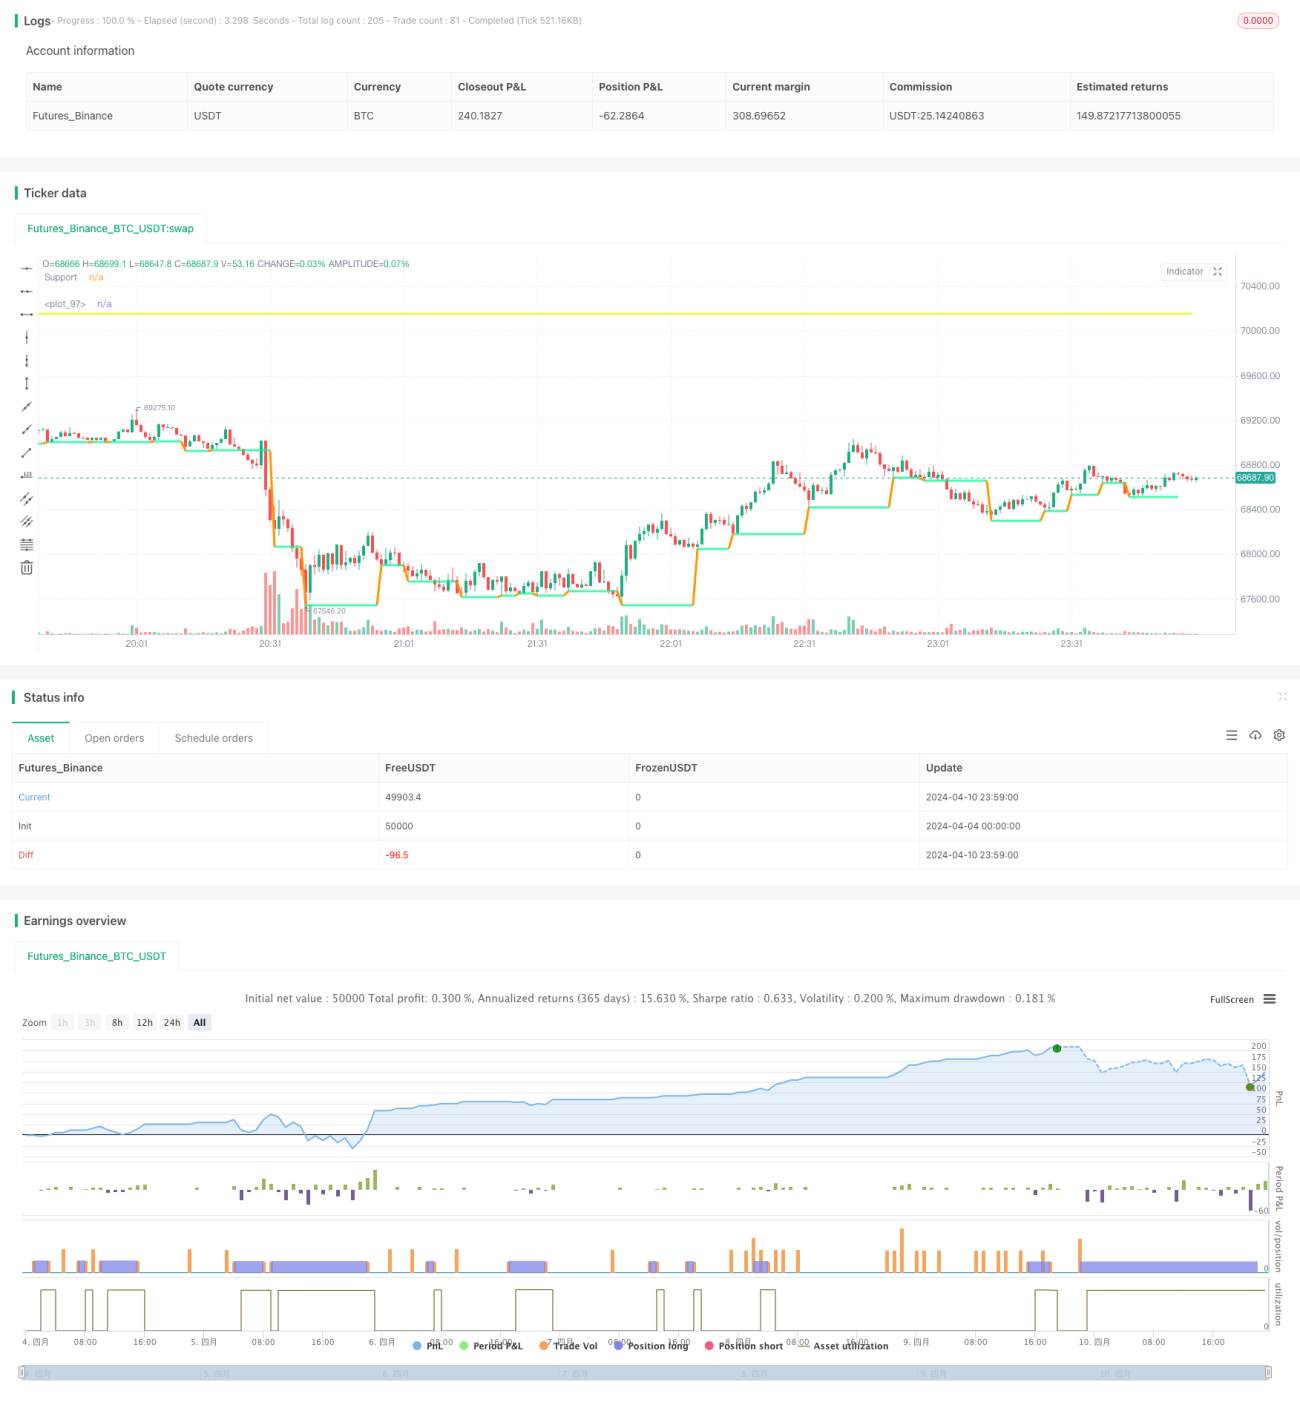
/*backtest
start: 2024-04-04 00:00:00
end: 2024-04-11 00:00:00
period: 1m
basePeriod: 1m
exchanges: [{"eid":"Futures_Binance","currency":"BTC_USDT"}]
*/

// This Pine Script™ code is subject to the terms of the Mozilla Public License 2.0 at https://mozilla.org/MPL/2.0/
// © AHMEDABDELAZIZZIZO

//@version=5Strategy parameters
Related strategies
Comment
All comments (0)
No data
- 1