SPARK 동적 포지션과 듀얼 인디케이터 트레이딩 전략

supertrend RSI ATR
생성 날짜: 2024-04-12 17:22:47 마지막으로 수정됨: 2024-04-12 17:22:47
복사: 0 클릭수: 778
avatar of ChaoZhang ChaoZhang
1
집중하다
1617
수행원

SPARK 동적 포지션과 듀얼 인디케이터 트레이딩 전략

개요

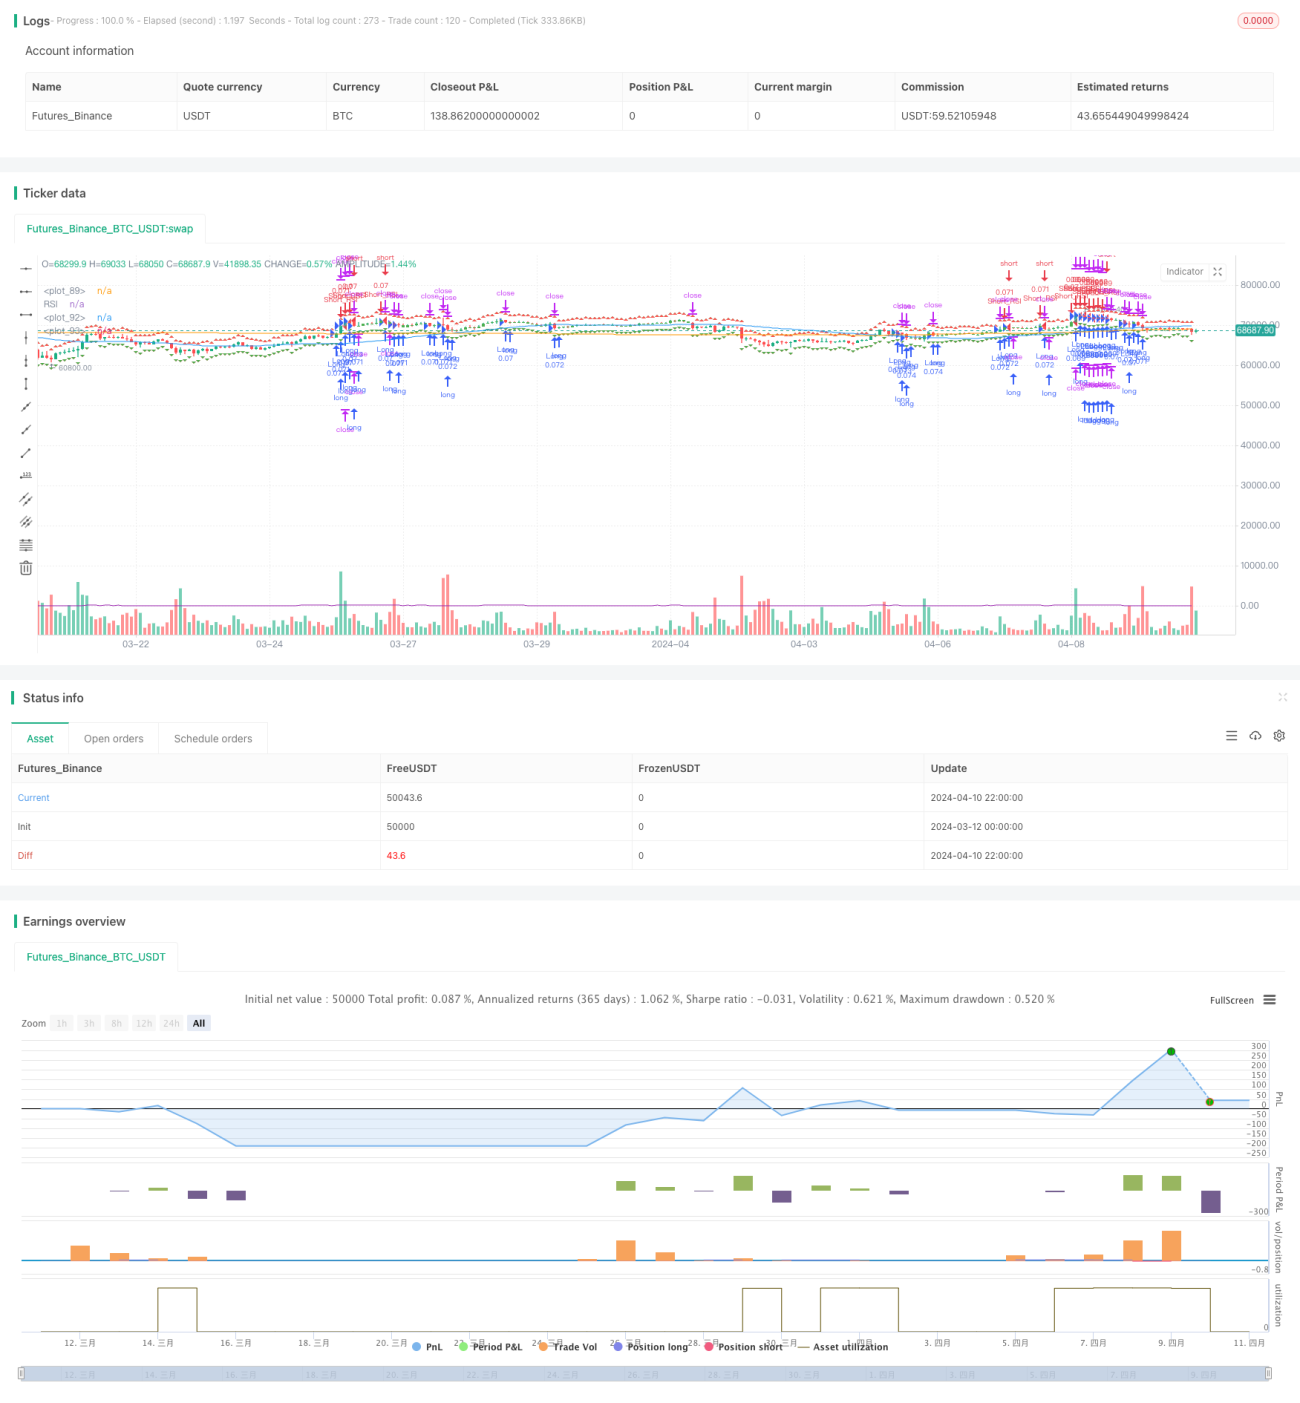
SPARK 전략은 동적 포지션 조정과 이중 지표 확인을 결합한 양적 거래 전략이다. 이 전략은 SuperTrend 지표와 상대적으로 강한 지수 ((RSI) 를 사용하여 잠재적인 진입 및 출구 지점을 식별하고 동적 포지션 조정 메커니즘을 사용하여 자금 분배를 최적화한다. 전략은 또한 유연한 중지 손실 설정을 제공하며 최소 거래 빈도 제어 및 방향성 선호 선택과 같은 사용자 정의 매개 변수를 제공합니다.

전략 원칙

스파크 전략의 핵심은 슈퍼 트렌드 지표와 RSI 지표의 결합 응용이다. 슈퍼 트렌드 지표는 마감 가격과 역동적인 지원 저항 위치 관계를 비교하여 트렌드 방향을 판단하는 반면, RSI 지표는 시장의 초과 매매 상태를 식별하는 데 사용됩니다. 슈퍼 트렌드 및 RSI 지표가 특정 조건을 동시에 충족하면 전략이 발사됩니다. 신호

전략은 동적 위치 조정 메커니즘을 사용하여 각 거래의 자금 분배를 최적화합니다. 포트폴리오 비율과 레버리지를 설정하여 전략은 현재 시장 상황과 계정 잔액에 따라 최적의 위치 크기를 자동으로 계산할 수 있습니다. 또한 전략은 고정 비율 또는 동적 계산 방법을 선택할 수있는 유연한 중지 손실 설정을 제공합니다.

전략적 이점

  1. 이중 지표 확인: 슈퍼 트렌드와 RSI 두 지표를 결합하여 SPARK 전략은 잠재적인 입구와 출구 지점을 더 정확하게 식별하여 잘못된 판단의 가능성을 줄일 수 있습니다.
  2. 다이내믹 포지션 조정: 전략은 포트폴리오 비율과 레버리지에 따라 자동으로 각 거래의 자금 분배를 최적화하여 자금 활용 효율성을 높일 수 있는 다이내믹 포지션 조정 메커니즘을 사용합니다.
  3. 유연한 위험 관리: 전략은 개인 위험 선호도에 따라 고정된 비율 또는 동적 계산 방식을 선택할 수 있는 유연한 스톱 스톱 손실 설정을 제공하여 정확한 위험 통제를 구현합니다.
  4. 사용자 정의 변수: 전략은 사용자가 다양한 시장 조건과 거래 선호도에 맞게 ATR 길이, 배수, RSI 마이너스 등과 같은 여러 입력 변수를 조정할 수 있습니다.

전략적 위험

  1. 시장 위험: SPARK 전략은 이중 지표 확인 및 동적 위치 조정 메커니즘을 사용하지만, 극단적 인 시장 조건에서 손실 위험이 발생할 수 있습니다.
  2. 매개 변수 최적화 위험: 전략의 성능은 입력 매개 변수의 선택에 크게 의존한다. 부적절한 매개 변수 설정은 전략의 부적절한 성능을 초래할 수 있다.
  3. 과도한 적합성 위험: 전략의 매개 변수가 지나치게 최적화되면, 전략이 미래의 시장 조건에서 좋지 않은 성과를 낼 수 있다.

전략 최적화 방향

  1. 더 많은 지표를 도입: 신호 확인의 정확성을 더욱 높이기 위해 MACD, 브린 밴드 등과 같은 다른 기술 지표를 도입하는 것을 고려하십시오.
  2. 정지 손실 메커니즘을 최적화하십시오: 수익을 더 잘 보호하고 손실을 제한하기 위해 이동 중지, 동적 중지 등과 같은 더 고급 정지 손실 전략을 탐구하십시오.
  3. 적응 파라미터 조정: 시장 상황에 따라 전략 파라미터를 조정하는 적응 메커니즘을 개발하여 변화하는 시장 환경에 적응하십시오.

요약하다

SPARK 전략은 슈퍼 트렌드 및 RSI 지표와 결합하여 동적 포지션 조정 장치와 유연한 위험 관리 도구를 사용하여 거래자에게 포괄적인 양적 거래 솔루션을 제공합니다. 전략은 약간의 위험에 직면 할 수 있지만, 지속적인 최적화 및 개선으로 SPARK 전략은 다양한 시장 조건에서 안정적인 성능을 발휘할 것으로 예상됩니다.

전략 소스 코드
/*backtest
start: 2024-03-12 00:00:00
end: 2024-04-11 00:00:00
period: 2h
basePeriod: 15m
exchanges: [{"eid":"Futures_Binance","currency":"BTC_USDT"}]
*/

//@version=4
strategy("SPARK", shorttitle="SPARK", overlay=true)

// Choose whether to activate the minimal bars in trade feature
minBarsEnabled = input(true, title="Activate Minimal Bars in Trade")
portfolioPercentage = input(10, title="Portfolio Percentage", minval=1, maxval=100)
// Leverage Input
leverage = input(1, title="Leverage", minval=1)

// Calculate position size according to portfolio percentage and leverage
positionSizePercent = portfolioPercentage / 100 * leverage
positionSize = (strategy.initial_capital / close) * positionSizePercent

// Take Profit and Stop Loss settings
useFixedTPSL = input(1, title="Use Fixed TP/SL", options=[1, 0])
tp_sl_step = 0.1
fixedTP = input(2.0, title="Fixed Take Profit (%)", step=tp_sl_step)
fixedSL = input(1.0, title="Fixed Stop Loss (%)", step=tp_sl_step)

// Calculate Take Profit and Stop Loss Levels
takeProfitLong = close * (1 + fixedTP / 100)
takeProfitShort = close * (1 - fixedTP / 100)
stopLossLong = close * (1 - fixedSL / 100)
stopLossShort = close * (1 + fixedSL / 100)

// Plot TP and SL levels on the chart
plotshape(series=takeProfitLong, title="Take Profit Long", color=color.green, style=shape.triangleup, location=location.abovebar)
plotshape(series=takeProfitShort, title="Take Profit Short", color=color.red, style=shape.triangledown, location=location.belowbar)
plotshape(series=stopLossLong, title="Stop Loss Long", color=color.red, style=shape.triangleup, location=location.abovebar)
plotshape(series=stopLossShort, title="Stop Loss Short", color=color.green, style=shape.triangledown, location=location.belowbar)

// Minimum Bars Between Trades Input
minBarsBetweenTrades = input(5, title="Minimum Bars Between Trades")

// Inputs for selecting trading direction
tradingDirection = input("Both", "Choose Trading Direction", options=["Long", "Short", "Both"])

// SuperTrend Function
trendFlow(src, atrLength, multiplier) =>
    atr = atr(atrLength)
    up = hl2 - (multiplier * atr)
    dn = hl2 + (multiplier * atr)
    trend = 1
    trend := nz(trend[1], 1)
    up := src > nz(up[1], 0) and src[1] > nz(up[1], 0) ? max(up, nz(up[1], 0)) : up
    dn := src < nz(dn[1], 0) and src[1] < nz(dn[1], 0) ? min(dn, nz(dn[1], 0)) : dn
    trend := src > nz(dn[1], 0) ? 1 : src < nz(up[1], 0)? -1 : nz(trend[1], 1)
    [up, dn, trend]

// Inputs for SuperTrend settings
atrLength1 = input(7, title="ATR Length for Trend 1")
multiplier1 = input(4.0, title="Multiplier for Trend 1")
atrLength2 = input(14, title="ATR Length for Trend 2")
multiplier2 = input(3.618, title="Multiplier for Trend 2")
atrLength3 = input(21, title="ATR Length for Trend 3")
multiplier3 = input(3.5, title="Multiplier for Trend 3")
atrLength4 = input(28, title="ATR Length for Trend 4")
multiplier4 = input(3.382, title="Multiplier for Trend 4")

// Calculate SuperTrend
[up1, dn1, trend1] = trendFlow(close, atrLength1, multiplier1)
[up2, dn2, trend2] = trendFlow(close, atrLength2, multiplier2)
[up3, dn3, trend3] = trendFlow(close, atrLength3, multiplier3)
[up4, dn4, trend4] = trendFlow(close, atrLength4, multiplier4)

// Entry Conditions based on SuperTrend and Elliott Wave-like patterns
longCondition = trend1 == 1 and trend2 == 1 and trend3 == 1 and trend4 == 1
shortCondition = trend1 == -1 and trend2 == -1 and trend3 == -1 and trend4 == -1

// Calculate bars since last trade
barsSinceLastTrade = barssince(tradingDirection == "Long" ? longCondition : shortCondition)

// Strategy Entry logic based on selected trading direction and minimum bars between trades
if tradingDirection == "Long" or tradingDirection == "Both"
    if longCondition and (not minBarsEnabled or barsSinceLastTrade >= minBarsBetweenTrades)
        strategy.entry("Long", strategy.long, qty=positionSize)
        strategy.exit("TP/SL Long", from_entry="Long", stop=stopLossLong, limit=takeProfitLong)

if tradingDirection == "Short" or tradingDirection == "Both"
    if shortCondition and (not minBarsEnabled or barsSinceLastTrade >= minBarsBetweenTrades)
        strategy.entry("Short", strategy.short, qty=positionSize)
        strategy.exit("TP/SL Short", from_entry="Short", stop=stopLossShort, limit=takeProfitShort)

// Color bars based on position
var color barColor = na
barColor := strategy.position_size > 0 ? color.green : strategy.position_size < 0 ? color.red : na

// Plot colored bars
plotcandle(open, high, low, close, color=barColor)

// Plot moving averages
plot(sma(close, 50), color=color.blue)
plot(sma(close, 200), color=color.orange)

// More customizable trading bot - adding a new indicator
// This indicator is the RSI (Relative Strength Index)

// RSI Inputs
rsi_length = input(14, title="RSI Length")
rsi_oversold = input(30, title="RSI Oversold")
rsi_overbought = input(70, title="RSI Overbought")

// Calculate RSI
rsi = rsi(close, rsi_length)

// Plot RSI
plot(rsi, color=color.purple, title="RSI")

// Entry Conditions based on RSI
rsi_long_condition = rsi < rsi_oversold
rsi_short_condition = rsi > rsi_overbought

// Strategy Entry logic based on RSI
if tradingDirection == "Long" or tradingDirection == "Both"
    if rsi_long_condition and (not minBarsEnabled or barsSinceLastTrade >= minBarsBetweenTrades)
        strategy.entry("Long_RSI", strategy.long, qty=positionSize)
        strategy.exit("TP/SL Long_RSI", from_entry="Long_RSI", stop=stopLossLong, limit=takeProfitLong)

if tradingDirection == "Short" or tradingDirection == "Both"
    if rsi_short_condition and (not minBarsEnabled or barsSinceLastTrade >= minBarsBetweenTrades)
        strategy.entry("Short_RSI", strategy.short, qty=positionSize)
        strategy.exit("TP/SL Short_RSI", from_entry="Short_RSI", stop=stopLossShort, limit=takeProfitShort)